Travelers 2012 Annual Report Download - page 93
Download and view the complete annual report
Please find page 93 of the 2012 Travelers annual report below. You can navigate through the pages in the report by either clicking on the pages listed below, or by using the keyword search tool below to find specific information within the annual report.-
 1
1 -
2
-
3
-
4
-
5
-
6
-
7
-
8
-
9
-
10
-
11
-
12
-
13
-
14
-
15
-
16
-
17
-
18
-
19
-
20
-
21
-
22
-
23
-
24
-
25
-
26
-
27
-
28
-
29
-
30
-
31
-
32
-
33
-
34
-
35
-
36
-
37
-
38
-
39
-
40
-
41
-
42
-
43
-
44
-
45
-
46
-
47
-
48
-
49
-
50
-
51
-
52
-
53
-
54
-
55
-
56
-
57
-
58
-
59
-
60
-
61
-
62
-
63
-
64
-
65
-
66
-
67
-
68
-
69
-
70
-
71
-
72
-
73
-
74
-
75
-
76
-
77
-
78
-
79
-
80
-
81
-
82
-
 83
83 -
 84
84 -
 85
85 -
 86
86 -
 87
87 -
 88
88 -
 89
89 -
 90
90 -
 91
91 -
 92
92 -
 93
93 -
 94
94 -
 95
95 -
 96
96 -
 97
97 -
 98
98 -
 99
99 -
 100
100 -
 101
101 -
 102
102 -
 103
103 -
104
-
105
-
106
-
107
-
108
-
109
-
110
-
111
-
112
-
113
-
114
-
115
-
116
-
117
-
118
-
119
-
120
-
121
-
122
-
123
-
124
-
125
-
126
-
127
-
128
-
129
-
130
-
131
-
132
-
133
-
134
-
135
-
136
-
137
-
138
-
139
-
140
-
141
-
142
-
143
-
144
-
145
-
146
-
147
-
148
-
149
-
150
-
151
-
152
-
153
-
154
-
155
-
156
-
157
-
158
-
159
-
160
-
161
-
162
-
163
-
164
-
165
-
166
-
167
-
168
-
169
-
170
-
171
-
172
-
173
-
174
-
175
-
176
-
177
-
178
-
179
-
180
-
181
-
182
-
183
-
184
-
185
-
186
-
187
-
188
-
189
-
190
-
191
-
192
-
193
-
194
-
195
-
196
-
197
-
198
-
199
-
200
-
201
-
202
-
203
-
204
-
205
-
206
-
207
-
208
-
209
-
210
-
211
-
212
-
213
-
214
-
215
-
216
-
217
-
218
-
219
-
220
-
221
-
222
-
223
-
224
-
225
-
226
-
227
-
228
-
229
-
230
-
231
-
232
-
233
-
234
-
235
-
236
-
237
-
238
-
239
-
240
-
241
-
242
-
243
-
244
-
245
-
246
-
247
-
248
-
249
-
250
-
251
-
252
-
253
-
254
-
255
-
256
-
257
-
258
-
259
-
260
-
261
-
262
-
263
-
264
-
265
-
266
-
267
-
268
-
269
-
270
-
271
-
272
-
273
-
274
-
275
-
276
-
277
-
278
-
279
-
280
-
281
-
282
-
283
-
284
-
285
-
286
-
287
-
288
-
289
-
290
-
291
-
292
-
293
-
294
-
295
-
296
-
297
-
298
-
299
-
300
 |
 |
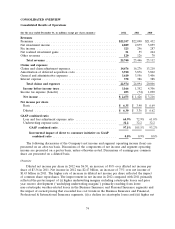
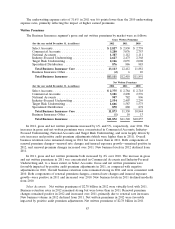
Revenues
Earned Premiums
Earned premiums in 2012 were $11.69 billion, $364 million or 3% higher than in 2011. Earned
premiums in 2011 were $11.33 billion, $561 million or 5% higher than in 2010. The increases in both
years primarily reflected the impact of increases in net written premiums over the preceding twelve
months. Earned premiums in 2012 and 2011 also benefited from positive audit premium adjustments
related to increased insured exposures for existing policyholders, compared with negative audit
premium adjustments in 2010 related to decreased insured exposures for existing policyholders.
Net Investment Income
Net investment income in 2012 was $2.09 billion, $49 million or 2% higher than in 2011, primarily
due to higher net investment income generated by non-fixed maturity investments, partially offset by
lower net investment income from fixed maturity investments. Net investment income in 2011 was $2.04
billion, $115 million or 5% lower than in 2010, primarily due to lower net investment income generated
by fixed maturity investments. Refer to the ‘‘Net Investment Income’’ section of the ‘‘Consolidated
Results of Operations’’ discussion herein for a description of the factors contributing to the changes in
the Company’s consolidated net investment income in 2012 and 2011 compared with the respective
prior years. In addition, refer to note 2 of notes to the Company’s consolidated financial statements
herein for a discussion of the Company’s net investment income allocation methodology.
Fee Income
National Accounts is the primary source of fee income due to its service businesses, which include
claim and loss prevention services to large companies that choose to self-insure a portion of their
insurance risks, as well as claims and policy management services to workers’ compensation residual
market pools. Fee income in 2012 increased by $27 million or 9% over 2011. Fee income in 2011
increased by $10 million or 4% over 2010. The increases in both years primarily reflected higher
serviced premium volume in workers’ compensation residual market pools.
Claims and Expenses
Claims and Claim Adjustment Expenses
Claims and claim adjustment expenses in 2012 were $7.86 billion, $590 million or 7% lower than in
2011, primarily reflecting (i) a decline in catastrophe losses, (ii) lower non-catastrophe weather-related
losses and (iii) an increase in net favorable prior year reserve development, partially offset by (iv) the
impact of loss cost trends. Catastrophe losses in 2012 were $794 million, compared with $1.02 billion in
2011. Net favorable prior year reserve development in 2012 was $467 million, compared with $245
million in 2011. Factors contributing to net favorable prior year reserve development are discussed in
more detail in note 7 of notes to the Company’s consolidated financial statements.
Claims and claim adjustment expenses in 2011 were $8.45 billion, $1.94 billion or 30% higher than
in 2010. The increase in 2011 primarily reflected (i) a significant decline in net favorable prior year
reserve development, (ii) a significant increase in catastrophe losses and (iii) the impact of loss cost
trends that included slightly higher than expected loss costs in the workers’ compensation and
commercial auto product lines. Net favorable prior year reserve development in 2011 was $245 million,
compared with $901 million in 2010. Factors contributing to net favorable prior year reserve
development are discussed in more detail in note 7 of notes to the Company’s consolidated financial
statements. Catastrophe losses in 2011 were $1.02 billion, compared with $437 million in 2010.
81