Travelers 2012 Annual Report Download - page 120
Download and view the complete annual report
Please find page 120 of the 2012 Travelers annual report below. You can navigate through the pages in the report by either clicking on the pages listed below, or by using the keyword search tool below to find specific information within the annual report.-
 1
1 -
2
-
3
-
4
-
5
-
6
-
7
-
8
-
9
-
10
-
11
-
12
-
13
-
14
-
15
-
16
-
17
-
18
-
19
-
20
-
21
-
22
-
23
-
24
-
25
-
26
-
27
-
28
-
29
-
30
-
31
-
32
-
33
-
34
-
35
-
36
-
37
-
38
-
39
-
40
-
41
-
42
-
43
-
44
-
45
-
46
-
47
-
48
-
49
-
50
-
51
-
52
-
53
-
54
-
55
-
56
-
57
-
58
-
59
-
60
-
61
-
62
-
63
-
64
-
65
-
66
-
67
-
68
-
69
-
70
-
71
-
72
-
73
-
74
-
75
-
76
-
77
-
78
-
79
-
80
-
81
-
82
-
83
-
84
-
85
-
86
-
87
-
88
-
89
-
90
-
91
-
92
-
93
-
94
-
95
-
96
-
97
-
98
-
99
-
100
-
101
-
102
-
103
-
104
-
105
-
106
-
107
-
108
-
109
-
 110
110 -
 111
111 -
 112
112 -
 113
113 -
 114
114 -
 115
115 -
 116
116 -
 117
117 -
 118
118 -
 119
119 -
 120
120 -
 121
121 -
 122
122 -
 123
123 -
 124
124 -
 125
125 -
 126
126 -
 127
127 -
 128
128 -
 129
129 -
 130
130 -
131
-
132
-
133
-
134
-
135
-
136
-
137
-
138
-
139
-
140
-
141
-
142
-
143
-
144
-
145
-
146
-
147
-
148
-
149
-
150
-
151
-
152
-
153
-
154
-
155
-
156
-
157
-
158
-
159
-
160
-
161
-
162
-
163
-
164
-
165
-
166
-
167
-
168
-
169
-
170
-
171
-
172
-
173
-
174
-
175
-
176
-
177
-
178
-
179
-
180
-
181
-
182
-
183
-
184
-
185
-
186
-
187
-
188
-
189
-
190
-
191
-
192
-
193
-
194
-
195
-
196
-
197
-
198
-
199
-
200
-
201
-
202
-
203
-
204
-
205
-
206
-
207
-
208
-
209
-
210
-
211
-
212
-
213
-
214
-
215
-
216
-
217
-
218
-
219
-
220
-
221
-
222
-
223
-
224
-
225
-
226
-
227
-
228
-
229
-
230
-
231
-
232
-
233
-
234
-
235
-
236
-
237
-
238
-
239
-
240
-
241
-
242
-
243
-
244
-
245
-
246
-
247
-
248
-
249
-
250
-
251
-
252
-
253
-
254
-
255
-
256
-
257
-
258
-
259
-
260
-
261
-
262
-
263
-
264
-
265
-
266
-
267
-
268
-
269
-
270
-
271
-
272
-
273
-
274
-
275
-
276
-
277
-
278
-
279
-
280
-
281
-
282
-
283
-
284
-
285
-
286
-
287
-
288
-
289
-
290
-
291
-
292
-
293
-
294
-
295
-
296
-
297
-
298
-
299
-
300
 |
 |

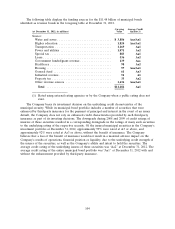
Other Investments
At December 31, 2012 and 2011, the carrying value of the Company’s other investments was
$3.43 billion and $3.45 billion, respectively. The Company’s other investments are primarily comprised
of private equity limited partnerships, hedge funds, real estate partnerships, joint ventures, mortgage
loans, venture capital (through direct ownership and limited partnerships) and trading securities, which
are subject to more volatility than the Company’s fixed maturity investments. These asset classes have
historically provided a higher return than fixed maturities but are subject to more volatility. Net
investment income provided by these asset classes was $414 million, $292 million and $304 million in
2012, 2011 and 2010, respectively. The increase in 2012 was primarily driven by improved results from
the Company’s real estate partnerships and hedge fund investments.
Securities Lending
The Company has engaged in securities lending activities from which it generates net investment
income by lending certain of its investments to other institutions for short periods of time. At
December 31, 2012 and 2011, the Company had $403 million and $126 million of securities on loan,
respectively, as part of a tri-party lending agreement. The average monthly balance of securities on loan
during 2012 and 2011 was $197 million and $170 million, respectively. Borrowers of these securities
provide collateral equal to at least 102% of the market value of the loaned securities plus accrued
interest. The Company has not incurred any investment losses in its securities lending program for the
years ended December 31, 2012, 2011 and 2010.
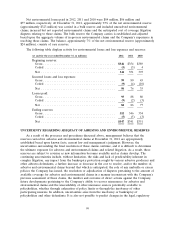
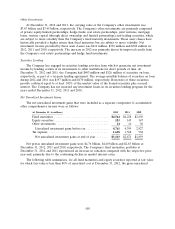
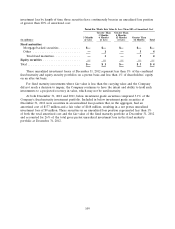
Net Unrealized Investment Gains
The net unrealized investment gains that were included as a separate component of accumulated
other comprehensive income were as follows:
(at December 31, in millions) 2012 2011 2010
Fixed maturities ............................... $4,564 $4,238 $2,650
Equity securities ............................... 183 145 147
Other investments ............................. 14 16 30
Unrealized investment gains before tax ............. 4,761 4,399 2,827
Tax expense .................................. 1,658 1,528 968
Net unrealized investment gains at end of year ....... $3,103 $2,871 $1,859
Net pretax unrealized investment gains were $4.76 billion, $4.40 billion and $2.83 billion at
December 31, 2012, 2011 and 2010, respectively. The Company’s fixed maturities portfolio at
December 31, 2012 and 2011 experienced an increase in valuation compared with the respective prior
year-end, primarily due to the continuing decline in market interest rates.
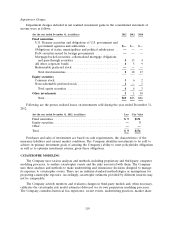
The following table summarizes, for all fixed maturities and equity securities reported at fair value
for which fair value is less than 80% of amortized cost at December 31, 2012, the gross unrealized
108