Travelers 2012 Annual Report Download - page 126
Download and view the complete annual report
Please find page 126 of the 2012 Travelers annual report below. You can navigate through the pages in the report by either clicking on the pages listed below, or by using the keyword search tool below to find specific information within the annual report.-
 1
1 -
2
-
3
-
4
-
5
-
6
-
7
-
8
-
9
-
10
-
11
-
12
-
13
-
14
-
15
-
16
-
17
-
18
-
19
-
20
-
21
-
22
-
23
-
24
-
25
-
26
-
27
-
28
-
29
-
30
-
31
-
32
-
33
-
34
-
35
-
36
-
37
-
38
-
39
-
40
-
41
-
42
-
43
-
44
-
45
-
46
-
47
-
48
-
49
-
50
-
51
-
52
-
53
-
54
-
55
-
56
-
57
-
58
-
59
-
60
-
61
-
62
-
63
-
64
-
65
-
66
-
67
-
68
-
69
-
70
-
71
-
72
-
73
-
74
-
75
-
76
-
77
-
78
-
79
-
80
-
81
-
82
-
83
-
84
-
85
-
86
-
87
-
88
-
89
-
90
-
91
-
92
-
93
-
94
-
95
-
96
-
97
-
98
-
99
-
100
-
101
-
102
-
103
-
104
-
105
-
106
-
107
-
108
-
109
-
110
-
111
-
112
-
113
-
114
-
115
-
 116
116 -
 117
117 -
 118
118 -
 119
119 -
 120
120 -
 121
121 -
 122
122 -
 123
123 -
 124
124 -
 125
125 -
 126
126 -
 127
127 -
 128
128 -
 129
129 -
 130
130 -
 131
131 -
 132
132 -
 133
133 -
 134
134 -
 135
135 -
 136
136 -
137
-
138
-
139
-
140
-
141
-
142
-
143
-
144
-
145
-
146
-
147
-
148
-
149
-
150
-
151
-
152
-
153
-
154
-
155
-
156
-
157
-
158
-
159
-
160
-
161
-
162
-
163
-
164
-
165
-
166
-
167
-
168
-
169
-
170
-
171
-
172
-
173
-
174
-
175
-
176
-
177
-
178
-
179
-
180
-
181
-
182
-
183
-
184
-
185
-
186
-
187
-
188
-
189
-
190
-
191
-
192
-
193
-
194
-
195
-
196
-
197
-
198
-
199
-
200
-
201
-
202
-
203
-
204
-
205
-
206
-
207
-
208
-
209
-
210
-
211
-
212
-
213
-
214
-
215
-
216
-
217
-
218
-
219
-
220
-
221
-
222
-
223
-
224
-
225
-
226
-
227
-
228
-
229
-
230
-
231
-
232
-
233
-
234
-
235
-
236
-
237
-
238
-
239
-
240
-
241
-
242
-
243
-
244
-
245
-
246
-
247
-
248
-
249
-
250
-
251
-
252
-
253
-
254
-
255
-
256
-
257
-
258
-
259
-
260
-
261
-
262
-
263
-
264
-
265
-
266
-
267
-
268
-
269
-
270
-
271
-
272
-
273
-
274
-
275
-
276
-
277
-
278
-
279
-
280
-
281
-
282
-
283
-
284
-
285
-
286
-
287
-
288
-
289
-
290
-
291
-
292
-
293
-
294
-
295
-
296
-
297
-
298
-
299
-
300
 |
 |

agreements vary based on a number of factors including, but not limited to, the reinsurers’ legal
structure and trading history with the Company.
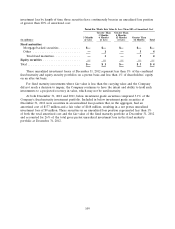
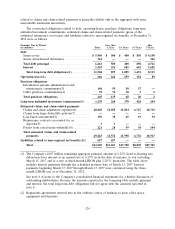
The following table summarizes the composition of the Company’s reinsurance recoverables:
(at December 31, in millions) 2012 2011
Gross reinsurance recoverables on paid and unpaid claims and
claim adjustment expenses ........................... $ 5,256 $ 6,255
Allowance for uncollectible reinsurance ................... (258) (345)
Net reinsurance recoverables .......................... 4,998 5,910
Mandatory pools and associations ....................... 2,549 2,020
Structured settlements ............................... 3,165 3,225
Total reinsurance recoverables ......................... $10,712 $11,155
The $912 million decline in net reinsurance recoverables since December 31, 2011 primarily
reflected the impact of cash collections, including commutation agreements, and the impact of net
favorable prior year reserve development.
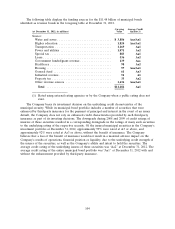
The following table presents the Company’s top five reinsurer groups by reinsurance recoverable at
December 31, 2012 (in millions). Also included is the A.M. Best rating of each reinsurer group at
February 19, 2013:
Reinsurance
Reinsurer Group Recoverable A.M. Best Rating of Group’s Predominant Reinsurer
Munich Re Group .................... $550 A+ second highest of 16 ratings
Swiss Re Group ...................... 517 A+ second highest of 16 ratings
Alleghany Group(1) ................... 302 A third highest of 16 ratings
XL Capital Group .................... 266 A third highest of 16 ratings
Berkshire Hathaway Group ............. 258 A++ highest of 16 ratings
(1) In 2012, Alleghany Corporation and Transatlantic Holdings, Inc. completed their merger. As a
result, Transatlantic became an operating subsidiary of Alleghany.
At December 31, 2012, the Company held $1.5 billion of collateral in the form of letters of credit,
funds and trust agreements held to fully or partially collateralize certain reinsurance recoverables.
For a discussion of a pending reinsurance dispute pertaining to a portion of the Company’s
reinsurance recoverable from the Munich Re Group in the foregoing table, see note 16 of notes to the
consolidated financial statements.
Also included in reinsurance recoverables are amounts related to structured settlements, which are
annuities purchased from various life insurance companies to settle certain personal physical injury
claims, of which workers’ compensation claims comprise a significant portion. In cases where the
Company did not receive a release from the claimant, the amount due from the life insurance company
related to the structured settlement is included in the Company’s consolidated balance sheet as a
liability and as a reinsurance recoverable, as the Company retains the contingent liability to the
claimant. In the event that the life insurance company fails to make the required annuity payments, the
Company would be required to make such payments if and to the extent the purchased annuities are
not covered by state guaranty associations. The following table presents the Company’s top five groups
114