Travelers 2012 Annual Report Download - page 206
Download and view the complete annual report
Please find page 206 of the 2012 Travelers annual report below. You can navigate through the pages in the report by either clicking on the pages listed below, or by using the keyword search tool below to find specific information within the annual report.-
 1
1 -
2
-
3
-
4
-
5
-
6
-
7
-
8
-
9
-
10
-
11
-
12
-
13
-
14
-
15
-
16
-
17
-
18
-
19
-
20
-
21
-
22
-
23
-
24
-
25
-
26
-
27
-
28
-
29
-
30
-
31
-
32
-
33
-
34
-
35
-
36
-
37
-
38
-
39
-
40
-
41
-
42
-
43
-
44
-
45
-
46
-
47
-
48
-
49
-
50
-
51
-
52
-
53
-
54
-
55
-
56
-
57
-
58
-
59
-
60
-
61
-
62
-
63
-
64
-
65
-
66
-
67
-
68
-
69
-
70
-
71
-
72
-
73
-
74
-
75
-
76
-
77
-
78
-
79
-
80
-
81
-
82
-
83
-
84
-
85
-
86
-
87
-
88
-
89
-
90
-
91
-
92
-
93
-
94
-
95
-
96
-
97
-
98
-
99
-
100
-
101
-
102
-
103
-
104
-
105
-
106
-
107
-
108
-
109
-
110
-
111
-
112
-
113
-
114
-
115
-
116
-
117
-
118
-
119
-
120
-
121
-
122
-
123
-
124
-
125
-
126
-
127
-
128
-
129
-
130
-
131
-
132
-
133
-
134
-
135
-
136
-
137
-
138
-
139
-
140
-
141
-
142
-
143
-
144
-
145
-
146
-
147
-
148
-
149
-
150
-
151
-
152
-
153
-
154
-
155
-
156
-
157
-
158
-
159
-
160
-
161
-
162
-
163
-
164
-
165
-
166
-
167
-
168
-
169
-
170
-
171
-
172
-
173
-
174
-
175
-
176
-
177
-
178
-
179
-
180
-
181
-
182
-
183
-
184
-
185
-
186
-
187
-
188
-
189
-
190
-
191
-
192
-
193
-
194
-
195
-
 196
196 -
 197
197 -
 198
198 -
 199
199 -
 200
200 -
 201
201 -
 202
202 -
 203
203 -
 204
204 -
 205
205 -
 206
206 -
 207
207 -
 208
208 -
 209
209 -
 210
210 -
 211
211 -
 212
212 -
 213
213 -
 214
214 -
 215
215 -
 216
216 -
217
-
218
-
219
-
220
-
221
-
222
-
223
-
224
-
225
-
226
-
227
-
228
-
229
-
230
-
231
-
232
-
233
-
234
-
235
-
236
-
237
-
238
-
239
-
240
-
241
-
242
-
243
-
244
-
245
-
246
-
247
-
248
-
249
-
250
-
251
-
252
-
253
-
254
-
255
-
256
-
257
-
258
-
259
-
260
-
261
-
262
-
263
-
264
-
265
-
266
-
267
-
268
-
269
-
270
-
271
-
272
-
273
-
274
-
275
-
276
-
277
-
278
-
279
-
280
-
281
-
282
-
283
-
284
-
285
-
286
-
287
-
288
-
289
-
290
-
291
-
292
-
293
-
294
-
295
-
296
-
297
-
298
-
299
-
300
 |
 |
THE TRAVELERS COMPANIES, INC. AND SUBSIDIARIES
NOTES TO CONSOLIDATED FINANCIAL STATEMENTS (Continued)
4. FAIR VALUE MEASUREMENTS (Continued)
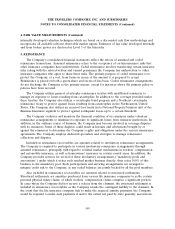
Equities—Public Common and Preferred
For public common and preferred stocks, the Company receives prices from a nationally
recognized pricing service that are based on observable market transactions and includes these
estimates in the amount disclosed in Level 1. Infrequently, current market quotes in active markets are
unavailable for certain non-redeemable preferred stocks held by the Company. In these instances, the
Company receives an estimate of fair value from the pricing service that provides fair value estimates
for the Company’s fixed maturities. The service utilizes some of the same methodologies to price the
non-redeemable preferred stocks as it does for the fixed maturities. The Company includes the fair
value estimate for these non-redeemable preferred stocks in the amount disclosed in Level 2.
Other Investments
The Company holds investments in various publicly-traded securities which are reported in other
investments. These investments include securities in the Company’s trading portfolio, mutual funds and
other small holdings. The $46 million and $42 million fair value of these investments at December 31,
2012 and 2011, respectively, was disclosed in Level 1. At December 31, 2012 and 2011, the Company
held investments in non-public common and preferred equity securities, with fair value estimates of
$54 million and $44 million, respectively, reported in other investments, where the fair value estimate is
determined either internally or by an external fund manager based on recent filings, operating results,
balance sheet stability, growth and other business and market sector fundamentals. Due to the
significant unobservable inputs in these valuations, the Company includes the total fair value estimate
for all of these investments at December 31, 2012 and 2011 in the amount disclosed in Level 3.
Derivatives
At December 31, 2012 and 2011, the Company held $21 million and $22 million, respectively, of
convertible bonds containing embedded conversion options that are valued separately from the host
bond contract in the amount disclosed in Level 2—fixed maturities.
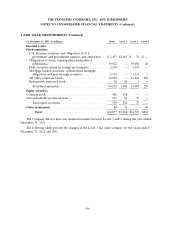
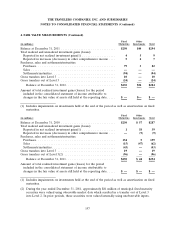
Fair Value Hierarchy
The following tables present the level within the fair value hierarchy at which the Company’s
financial assets and financial liabilities are measured on a recurring basis at December 31, 2012 and
2011. An investment transferred between levels during a period is transferred at its fair value as of the
beginning of that period.
194