Travelers 2012 Annual Report Download - page 101
Download and view the complete annual report
Please find page 101 of the 2012 Travelers annual report below. You can navigate through the pages in the report by either clicking on the pages listed below, or by using the keyword search tool below to find specific information within the annual report.-
 1
1 -
2
-
3
-
4
-
5
-
6
-
7
-
8
-
9
-
10
-
11
-
12
-
13
-
14
-
15
-
16
-
17
-
18
-
19
-
20
-
21
-
22
-
23
-
24
-
25
-
26
-
27
-
28
-
29
-
30
-
31
-
32
-
33
-
34
-
35
-
36
-
37
-
38
-
39
-
40
-
41
-
42
-
43
-
44
-
45
-
46
-
47
-
48
-
49
-
50
-
51
-
52
-
53
-
54
-
55
-
56
-
57
-
58
-
59
-
60
-
61
-
62
-
63
-
64
-
65
-
66
-
67
-
68
-
69
-
70
-
71
-
72
-
73
-
74
-
75
-
76
-
77
-
78
-
79
-
80
-
81
-
82
-
83
-
84
-
85
-
86
-
87
-
88
-
89
-
90
-
 91
91 -
 92
92 -
 93
93 -
 94
94 -
 95
95 -
 96
96 -
 97
97 -
 98
98 -
 99
99 -
 100
100 -
 101
101 -
 102
102 -
 103
103 -
 104
104 -
 105
105 -
 106
106 -
 107
107 -
 108
108 -
 109
109 -
 110
110 -
 111
111 -
112
-
113
-
114
-
115
-
116
-
117
-
118
-
119
-
120
-
121
-
122
-
123
-
124
-
125
-
126
-
127
-
128
-
129
-
130
-
131
-
132
-
133
-
134
-
135
-
136
-
137
-
138
-
139
-
140
-
141
-
142
-
143
-
144
-
145
-
146
-
147
-
148
-
149
-
150
-
151
-
152
-
153
-
154
-
155
-
156
-
157
-
158
-
159
-
160
-
161
-
162
-
163
-
164
-
165
-
166
-
167
-
168
-
169
-
170
-
171
-
172
-
173
-
174
-
175
-
176
-
177
-
178
-
179
-
180
-
181
-
182
-
183
-
184
-
185
-
186
-
187
-
188
-
189
-
190
-
191
-
192
-
193
-
194
-
195
-
196
-
197
-
198
-
199
-
200
-
201
-
202
-
203
-
204
-
205
-
206
-
207
-
208
-
209
-
210
-
211
-
212
-
213
-
214
-
215
-
216
-
217
-
218
-
219
-
220
-
221
-
222
-
223
-
224
-
225
-
226
-
227
-
228
-
229
-
230
-
231
-
232
-
233
-
234
-
235
-
236
-
237
-
238
-
239
-
240
-
241
-
242
-
243
-
244
-
245
-
246
-
247
-
248
-
249
-
250
-
251
-
252
-
253
-
254
-
255
-
256
-
257
-
258
-
259
-
260
-
261
-
262
-
263
-
264
-
265
-
266
-
267
-
268
-
269
-
270
-
271
-
272
-
273
-
274
-
275
-
276
-
277
-
278
-
279
-
280
-
281
-
282
-
283
-
284
-
285
-
286
-
287
-
288
-
289
-
290
-
291
-
292
-
293
-
294
-
295
-
296
-
297
-
298
-
299
-
300
 |
 |

declined from 2010, primarily as a result of the Company’s withdrawal from personal insurance business
in the Republic of Ireland. New business volume in International in 2011 decreased from 2010,
primarily reflecting the Company’s withdrawal from personal insurance business in the Republic of
Ireland and intentional underwriting actions in the Company’s operations at Lloyd’s. Renewal premium
changes were flat in 2011 (compared with slightly positive in 2010), as positive renewal rate changes
were offset by a decline in insured exposures.
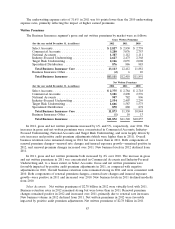
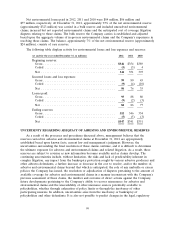
Personal Insurance
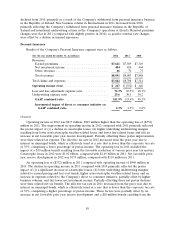
Results of the Company’s Personal Insurance segment were as follows:
(for the year ended December 31, in millions) 2012 2011 2010
Revenues:
Earned premiums ............................ $7,621 $7,589 $7,349
Net investment income ........................ 404 424 464
Other revenues .............................. 66 70 75
Total revenues ............................... $8,091 $8,083 $7,888
Total claims and expenses ........................ $7,842 $8,708 $7,314
Operating income (loss) ......................... $ 217 $ (332) $ 440
Loss and loss adjustment expense ratio .............. 72.3% 83.5% 68.1%
Underwriting expense ratio ....................... 29.6 30.1 30.2
GAAP combined ratio ......................... 101.9% 113.6% 98.3%
Incremental impact of direct to consumer initiative on
GAAP combined ratio ....................... 2.3% 2.5% 2.2%
Overview
Operating income in 2012 was $217 million, $549 million higher than the operating loss of ($332)
million in 2011. The improvement in operating income in 2012 compared with 2011 primarily reflected
the pretax impact of (i) a decline in catastrophe losses, (ii) higher underlying underwriting margins
resulting from lower non-catastrophe weather-related losses and lower fire-related losses and (iii) an
increase in net favorable prior year reserve development. Partially offsetting these pretax improvements
were their related tax expense. The effective tax rate in 2012 increased from the prior year due to
interest on municipal bonds, which is effectively taxed at a rate that is lower than the corporate tax rate
of 35%, comprising a lower percentage of pretax income. The operating loss in 2011 included the
impact of a $10 million benefit resulting from the favorable resolution of various prior year tax matters.
Catastrophe losses in 2012 were $1.02 billion, compared with $1.49 billion in 2011. Net favorable prior
year reserve development in 2012 was $175 million, compared with $110 million in 2011.
An operating loss of ($332) million in 2011 compared with operating income of $440 million in
2010. The decline in operating income in 2011 compared with 2010 primarily reflected the pretax
impact of (i) a significant increase in catastrophe losses, (ii) lower underlying underwriting margins
related to earned pricing and loss cost trends, higher non-catastrophe weather-related losses and an
increase in expenses related to the Company’s direct to consumer initiative, partially offset by higher
business volumes, and (iii) lower net investment income. Partially offsetting these net pretax declines
were their related net tax benefit. The effective tax rate in 2011 decreased from the prior year due to
interest on municipal bonds, which is effectively taxed at a rate that is lower than the corporate tax rate
of 35%, comprising a higher percentage of pretax income. These factors were partially offset by an
increase in net favorable prior year reserve development and a $10 million benefit resulting from the
89