Travelers 2012 Annual Report Download - page 193
Download and view the complete annual report
Please find page 193 of the 2012 Travelers annual report below. You can navigate through the pages in the report by either clicking on the pages listed below, or by using the keyword search tool below to find specific information within the annual report.-
 1
1 -
2
-
3
-
4
-
5
-
6
-
7
-
8
-
9
-
10
-
11
-
12
-
13
-
14
-
15
-
16
-
17
-
18
-
19
-
20
-
21
-
22
-
23
-
24
-
25
-
26
-
27
-
28
-
29
-
30
-
31
-
32
-
33
-
34
-
35
-
36
-
37
-
38
-
39
-
40
-
41
-
42
-
43
-
44
-
45
-
46
-
47
-
48
-
49
-
50
-
51
-
52
-
53
-
54
-
55
-
56
-
57
-
58
-
59
-
60
-
61
-
62
-
63
-
64
-
65
-
66
-
67
-
68
-
69
-
70
-
71
-
72
-
73
-
74
-
75
-
76
-
77
-
78
-
79
-
80
-
81
-
82
-
83
-
84
-
85
-
86
-
87
-
88
-
89
-
90
-
91
-
92
-
93
-
94
-
95
-
96
-
97
-
98
-
99
-
100
-
101
-
102
-
103
-
104
-
105
-
106
-
107
-
108
-
109
-
110
-
111
-
112
-
113
-
114
-
115
-
116
-
117
-
118
-
119
-
120
-
121
-
122
-
123
-
124
-
125
-
126
-
127
-
128
-
129
-
130
-
131
-
132
-
133
-
134
-
135
-
136
-
137
-
138
-
139
-
140
-
141
-
142
-
143
-
144
-
145
-
146
-
147
-
148
-
149
-
150
-
151
-
152
-
153
-
154
-
155
-
156
-
157
-
158
-
159
-
160
-
161
-
162
-
163
-
164
-
165
-
166
-
167
-
168
-
169
-
170
-
171
-
172
-
173
-
174
-
175
-
176
-
177
-
178
-
179
-
180
-
181
-
182
-
 183
183 -
 184
184 -
 185
185 -
 186
186 -
 187
187 -
 188
188 -
 189
189 -
 190
190 -
 191
191 -
 192
192 -
 193
193 -
 194
194 -
 195
195 -
 196
196 -
 197
197 -
 198
198 -
 199
199 -
 200
200 -
 201
201 -
 202
202 -
 203
203 -
204
-
205
-
206
-
207
-
208
-
209
-
210
-
211
-
212
-
213
-
214
-
215
-
216
-
217
-
218
-
219
-
220
-
221
-
222
-
223
-
224
-
225
-
226
-
227
-
228
-
229
-
230
-
231
-
232
-
233
-
234
-
235
-
236
-
237
-
238
-
239
-
240
-
241
-
242
-
243
-
244
-
245
-
246
-
247
-
248
-
249
-
250
-
251
-
252
-
253
-
254
-
255
-
256
-
257
-
258
-
259
-
260
-
261
-
262
-
263
-
264
-
265
-
266
-
267
-
268
-
269
-
270
-
271
-
272
-
273
-
274
-
275
-
276
-
277
-
278
-
279
-
280
-
281
-
282
-
283
-
284
-
285
-
286
-
287
-
288
-
289
-
290
-
291
-
292
-
293
-
294
-
295
-
296
-
297
-
298
-
299
-
300
 |
 |

THE TRAVELERS COMPANIES, INC. AND SUBSIDIARIES
NOTES TO CONSOLIDATED FINANCIAL STATEMENTS (Continued)
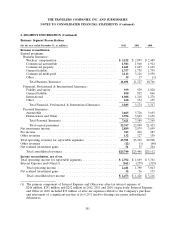
2. SEGMENT INFORMATION (Continued)
Business Segment Reconciliations
(for the year ended December 31, in millions) 2012 2011 2010
Revenue reconciliation
Earned premiums
Business Insurance:
Workers’ compensation ................................. $ 3,222 $ 2,899 $ 2,489
Commercial automobile ................................. 1,943 1,940 1,912
Commercial property ................................... 1,621 1,607 1,669
General liability ....................................... 1,757 1,738 1,739
Commercial multi-peril ................................. 3,113 3,126 2,958
Other .............................................. 35 17 (1)
Total Business Insurance ............................... 11,691 11,327 10,766
Financial, Professional & International Insurance:
Fidelity and surety ..................................... 939 970 1,020
General liability ....................................... 850 832 866
International ......................................... 1,088 1,218 1,276
Other .............................................. 168 154 155
Total Financial, Professional & International Insurance ......... 3,045 3,174 3,317
Personal Insurance:
Automobile .......................................... 3,665 3,720 3,693
Homeowners and Other ................................. 3,956 3,869 3,656
Total Personal Insurance ............................... 7,621 7,589 7,349
Total earned premiums ................................ 22,357 22,090 21,432
Net investment income ..................................... 2,889 2,879 3,059
Fee income ............................................. 323 296 287
Other revenues .......................................... 132 127 130
Total operating revenues for reportable segments .................. 25,701 25,392 24,908
Other revenues .......................................... (12) (1) (60)
Net realized investment gains ................................ 51 55 264
Total consolidated revenues .............................. $25,740 $25,446 $25,112
Income reconciliation, net of tax
Total operating income for reportable segments ................... $ 2,702 $ 1,669 $ 3,361
Interest Expense and Other(1) ............................... (261) (279) (318)
Total operating income ................................. 2,441 1,390 3,043
Net realized investment gains ................................ 32 36 173
Total consolidated net income ............................ $ 2,473 $ 1,426 $ 3,216
(1) The primary component of Interest Expense and Other was after-tax interest expense of
$246 million, $251 million and $252 million in 2012, 2011 and 2010, respectively. Interest Expense
and Other in 2010 included $39 million of after-tax expenses related to the Company’s purchase
and retirement of a significant portion of its 6.25% fixed-to-floating rate junior subordinated
debentures.
181