Travelers 2012 Annual Report Download - page 104
Download and view the complete annual report
Please find page 104 of the 2012 Travelers annual report below. You can navigate through the pages in the report by either clicking on the pages listed below, or by using the keyword search tool below to find specific information within the annual report.-
 1
1 -
2
-
3
-
4
-
5
-
6
-
7
-
8
-
9
-
10
-
11
-
12
-
13
-
14
-
15
-
16
-
17
-
18
-
19
-
20
-
21
-
22
-
23
-
24
-
25
-
26
-
27
-
28
-
29
-
30
-
31
-
32
-
33
-
34
-
35
-
36
-
37
-
38
-
39
-
40
-
41
-
42
-
43
-
44
-
45
-
46
-
47
-
48
-
49
-
50
-
51
-
52
-
53
-
54
-
55
-
56
-
57
-
58
-
59
-
60
-
61
-
62
-
63
-
64
-
65
-
66
-
67
-
68
-
69
-
70
-
71
-
72
-
73
-
74
-
75
-
76
-
77
-
78
-
79
-
80
-
81
-
82
-
83
-
84
-
85
-
86
-
87
-
88
-
89
-
90
-
91
-
92
-
93
-
 94
94 -
 95
95 -
 96
96 -
 97
97 -
 98
98 -
 99
99 -
 100
100 -
 101
101 -
 102
102 -
 103
103 -
 104
104 -
 105
105 -
 106
106 -
 107
107 -
 108
108 -
 109
109 -
 110
110 -
 111
111 -
 112
112 -
 113
113 -
 114
114 -
115
-
116
-
117
-
118
-
119
-
120
-
121
-
122
-
123
-
124
-
125
-
126
-
127
-
128
-
129
-
130
-
131
-
132
-
133
-
134
-
135
-
136
-
137
-
138
-
139
-
140
-
141
-
142
-
143
-
144
-
145
-
146
-
147
-
148
-
149
-
150
-
151
-
152
-
153
-
154
-
155
-
156
-
157
-
158
-
159
-
160
-
161
-
162
-
163
-
164
-
165
-
166
-
167
-
168
-
169
-
170
-
171
-
172
-
173
-
174
-
175
-
176
-
177
-
178
-
179
-
180
-
181
-
182
-
183
-
184
-
185
-
186
-
187
-
188
-
189
-
190
-
191
-
192
-
193
-
194
-
195
-
196
-
197
-
198
-
199
-
200
-
201
-
202
-
203
-
204
-
205
-
206
-
207
-
208
-
209
-
210
-
211
-
212
-
213
-
214
-
215
-
216
-
217
-
218
-
219
-
220
-
221
-
222
-
223
-
224
-
225
-
226
-
227
-
228
-
229
-
230
-
231
-
232
-
233
-
234
-
235
-
236
-
237
-
238
-
239
-
240
-
241
-
242
-
243
-
244
-
245
-
246
-
247
-
248
-
249
-
250
-
251
-
252
-
253
-
254
-
255
-
256
-
257
-
258
-
259
-
260
-
261
-
262
-
263
-
264
-
265
-
266
-
267
-
268
-
269
-
270
-
271
-
272
-
273
-
274
-
275
-
276
-
277
-
278
-
279
-
280
-
281
-
282
-
283
-
284
-
285
-
286
-
287
-
288
-
289
-
290
-
291
-
292
-
293
-
294
-
295
-
296
-
297
-
298
-
299
-
300
 |
 |

The underwriting expense ratio of 30.1% in 2011 was 0.1 points lower than the underwriting
expense ratio of 30.2% in 2010.
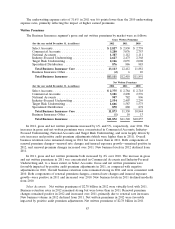
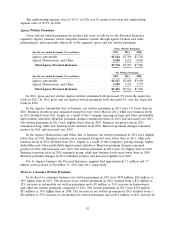
Agency Written Premiums
Gross and net written premiums by product line were as follows for the Personal Insurance
segment’s Agency business, which comprises business written through agents, brokers and other
intermediaries and represents almost all of the segment’s gross and net written premiums:
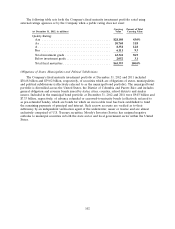
Gross Written Premiums
(for the year ended December 31, in millions) 2012 2011 2010
Agency Automobile ............................ $3,544 $3,706 $3,720
Agency Homeowners and Other ................... 4,220 4,221 4,060
Total Agency Personal Insurance ................. $7,764 $7,927 $7,780
Net Written Premiums
(for the year ended December 31, in millions) 2012 2011 2010
Agency Automobile ............................ $3,527 $3,688 $3,698
Agency Homeowners and Other ................... 3,909 3,923 3,772
Total Agency Personal Insurance ................. $7,436 $7,611 $7,470
In 2012, gross and net written Agency written premiums both decreased 2% from the respective
totals in 2011. In 2011, gross and net Agency written premiums both increased 2% over the respective
totals in 2010.
In the Agency Automobile line of business, net written premiums in 2012 were 4% lower than in
2011. Business retention rates remained strong but were lower than in 2011, while new business levels
in 2012 declined from 2011, largely as a result of the Company’s pricing strategy and other profitability
improvement initiatives. Renewal premium changes remained positive in 2012 and increased over 2011.
Net written premiums in 2011 were slightly lower than in 2010. Business retention rates in 2011
remained strong, while new business levels declined from 2010. Renewal premium changes remained
positive in 2011 and increased over 2010.
In the Agency Homeowners and Other line of business, net written premiums in 2012 were slightly
lower than in 2011. Business retention rates remained strong but were lower than in 2011, while new
business levels in 2012 declined from 2011, largely as a result of the Company’s pricing strategy, higher
deductibles and other profitability improvement initiatives. Renewal premium changes remained
positive in 2012 and increased over 2011. Net written premiums in 2011 were 4% higher than in 2010.
Business retention rates in 2011 remained strong, while new business levels were lower than in 2010.
Renewal premium changes in 2011 remained positive and increased slightly over 2010.
For its Agency business, the Personal Insurance segment had approximately 7.1 million and 7.7
million active policies at December 31, 2012 and 2011, respectively.
Direct to Consumer Written Premiums
In its direct to consumer business, net written premiums in 2012 were $158 million, $24 million or
18% higher than in 2011. The increase in net written premiums in 2012 resulted from a $15 million or
15% increase in automobile net written premiums and a $9 million or 26% increase in homeowners
and other net written premiums compared to 2011. Net written premiums in 2011 were $134 million,
$37 million or 38% higher than in 2010. The increase in net written premiums in 2011 resulted from a
$26 million or 35% increase in automobile net written premiums and an $11 million or 48% increase in
92