Travelers 2012 Annual Report Download - page 89
Download and view the complete annual report
Please find page 89 of the 2012 Travelers annual report below. You can navigate through the pages in the report by either clicking on the pages listed below, or by using the keyword search tool below to find specific information within the annual report.-
 1
1 -
2
-
3
-
4
-
5
-
6
-
7
-
8
-
9
-
10
-
11
-
12
-
13
-
14
-
15
-
16
-
17
-
18
-
19
-
20
-
21
-
22
-
23
-
24
-
25
-
26
-
27
-
28
-
29
-
30
-
31
-
32
-
33
-
34
-
35
-
36
-
37
-
38
-
39
-
40
-
41
-
42
-
43
-
44
-
45
-
46
-
47
-
48
-
49
-
50
-
51
-
52
-
53
-
54
-
55
-
56
-
57
-
58
-
59
-
60
-
61
-
62
-
63
-
64
-
65
-
66
-
67
-
68
-
69
-
70
-
71
-
72
-
73
-
74
-
75
-
76
-
77
-
78
-
 79
79 -
 80
80 -
 81
81 -
 82
82 -
 83
83 -
 84
84 -
 85
85 -
 86
86 -
 87
87 -
 88
88 -
 89
89 -
 90
90 -
 91
91 -
 92
92 -
 93
93 -
 94
94 -
 95
95 -
 96
96 -
 97
97 -
 98
98 -
 99
99 -
100
-
101
-
102
-
103
-
104
-
105
-
106
-
107
-
108
-
109
-
110
-
111
-
112
-
113
-
114
-
115
-
116
-
117
-
118
-
119
-
120
-
121
-
122
-
123
-
124
-
125
-
126
-
127
-
128
-
129
-
130
-
131
-
132
-
133
-
134
-
135
-
136
-
137
-
138
-
139
-
140
-
141
-
142
-
143
-
144
-
145
-
146
-
147
-
148
-
149
-
150
-
151
-
152
-
153
-
154
-
155
-
156
-
157
-
158
-
159
-
160
-
161
-
162
-
163
-
164
-
165
-
166
-
167
-
168
-
169
-
170
-
171
-
172
-
173
-
174
-
175
-
176
-
177
-
178
-
179
-
180
-
181
-
182
-
183
-
184
-
185
-
186
-
187
-
188
-
189
-
190
-
191
-
192
-
193
-
194
-
195
-
196
-
197
-
198
-
199
-
200
-
201
-
202
-
203
-
204
-
205
-
206
-
207
-
208
-
209
-
210
-
211
-
212
-
213
-
214
-
215
-
216
-
217
-
218
-
219
-
220
-
221
-
222
-
223
-
224
-
225
-
226
-
227
-
228
-
229
-
230
-
231
-
232
-
233
-
234
-
235
-
236
-
237
-
238
-
239
-
240
-
241
-
242
-
243
-
244
-
245
-
246
-
247
-
248
-
249
-
250
-
251
-
252
-
253
-
254
-
255
-
256
-
257
-
258
-
259
-
260
-
261
-
262
-
263
-
264
-
265
-
266
-
267
-
268
-
269
-
270
-
271
-
272
-
273
-
274
-
275
-
276
-
277
-
278
-
279
-
280
-
281
-
282
-
283
-
284
-
285
-
286
-
287
-
288
-
289
-
290
-
291
-
292
-
293
-
294
-
295
-
296
-
297
-
298
-
299
-
300
 |
 |
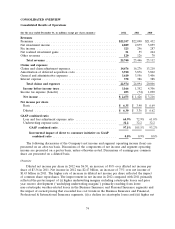
realized investment gains related to equity securities. These net realized investment gains were partially
offset by $14 million of net realized investment losses associated with U.S. Treasury futures contracts
(which require daily mark-to-market settlement and are used to shorten the duration of the Company’s
fixed maturity portfolio) and $8 million of net realized investment losses related to other investments.
Other net realized investment gains in 2011 of $80 million were primarily driven by $52 million of
net realized investment gains related to fixed maturity investments, $46 million of net realized
investment gains related to equity securities and $41 million of net realized investment gains related to
other investments, partially offset by net realized investment losses of $62 million associated with U.S.
Treasury futures contracts.
Other net realized investment gains in 2010 of $290 million were primarily driven by a $205 million
gain resulting from the Company’s sale of substantially all of its remaining common stock holdings in
Verisk Analytics, Inc. (Verisk) for total proceeds of approximately $230 million as part of a secondary
public offering of Verisk. The 2010 total also included $96 million of net realized investment gains
related to fixed maturity investments and $25 million of net realized investment gains related to equity
securities. These gains were partially offset by $30 million of net realized investment losses related to
U.S. Treasury futures contracts.
Other Revenues
Other revenues primarily consist of premium installment charges. In 2010, this category also
included $60 million of expenses related to the Company’s purchase and retirement of $885 million of
its $1.0 billion 6.25% fixed-to-floating rate junior subordinated debentures.
Claims and Expenses
Claims and Claim Adjustment Expenses
Claims and claim adjustment expenses in 2012 were $14.68 billion, $1.60 billion or 10% lower than
in 2011. The decrease primarily reflected (i) a decline in catastrophe losses and, to a lesser extent,
(ii) lower levels of non-catastrophe weather-related losses and (iii) higher net favorable prior year
reserve development, partially offset by (iv) the impact of loss cost trends. Catastrophe losses in 2012
and 2011 were $1.86 billion and $2.56 billion, respectively. Catastrophe losses in 2012 primarily resulted
from Storm Sandy, as well as multiple tornado, wind and hail storms in several regions of the United
States. Catastrophe losses in 2011 primarily resulted from Hurricane Irene and Tropical Storm Lee,
multiple tornadoes and hail storms in the Midwest and Southeast regions of the United States and
severe winter storms throughout the United States. Catastrophe losses in 2011 also included losses from
floods in Thailand and an earthquake in Japan that impacted the Financial, Professional &
International Insurance segment. Net favorable prior year reserve development in 2012 and 2011 was
$940 million and $715 million, respectively. Factors contributing to net favorable prior year reserve
development in each segment during these periods are discussed in more detail in note 7 of notes to
the Company’s consolidated financial statements.
Claims and claim adjustment expenses in 2011 were $16.28 billion, $3.07 billion or 23% higher
than in 2010. The increase primarily reflected (i) the significant increase in catastrophe losses, (ii) the
decrease in net favorable prior year reserve development, (iii) the impact of loss cost trends and
(iv) higher non-catastrophe weather-related losses. Catastrophe losses in 2011 and 2010 were $2.56
billion and $1.11 billion, respectively. Catastrophe losses in 2010 primarily resulted from several severe
wind and hail storms, as well as severe winter storms. In addition, catastrophe losses in 2010 included
losses from an earthquake in Chile that impacted the Financial, Professional & International Insurance
segment. Net favorable prior year reserve development in 2011 and 2010 was $715 million and $1.25
billion, respectively. Factors contributing to net favorable prior year reserve development in each
segment are discussed in note 7 of notes to the Company’s consolidated financial statements.
77