Travelers 2012 Annual Report Download - page 132
Download and view the complete annual report
Please find page 132 of the 2012 Travelers annual report below. You can navigate through the pages in the report by either clicking on the pages listed below, or by using the keyword search tool below to find specific information within the annual report.-
 1
1 -
2
-
3
-
4
-
5
-
6
-
7
-
8
-
9
-
10
-
11
-
12
-
13
-
14
-
15
-
16
-
17
-
18
-
19
-
20
-
21
-
22
-
23
-
24
-
25
-
26
-
27
-
28
-
29
-
30
-
31
-
32
-
33
-
34
-
35
-
36
-
37
-
38
-
39
-
40
-
41
-
42
-
43
-
44
-
45
-
46
-
47
-
48
-
49
-
50
-
51
-
52
-
53
-
54
-
55
-
56
-
57
-
58
-
59
-
60
-
61
-
62
-
63
-
64
-
65
-
66
-
67
-
68
-
69
-
70
-
71
-
72
-
73
-
74
-
75
-
76
-
77
-
78
-
79
-
80
-
81
-
82
-
83
-
84
-
85
-
86
-
87
-
88
-
89
-
90
-
91
-
92
-
93
-
94
-
95
-
96
-
97
-
98
-
99
-
100
-
101
-
102
-
103
-
104
-
105
-
106
-
107
-
108
-
109
-
110
-
111
-
112
-
113
-
114
-
115
-
116
-
117
-
118
-
119
-
120
-
121
-
 122
122 -
 123
123 -
 124
124 -
 125
125 -
 126
126 -
 127
127 -
 128
128 -
 129
129 -
 130
130 -
 131
131 -
 132
132 -
 133
133 -
 134
134 -
 135
135 -
 136
136 -
 137
137 -
 138
138 -
 139
139 -
 140
140 -
 141
141 -
 142
142 -
143
-
144
-
145
-
146
-
147
-
148
-
149
-
150
-
151
-
152
-
153
-
154
-
155
-
156
-
157
-
158
-
159
-
160
-
161
-
162
-
163
-
164
-
165
-
166
-
167
-
168
-
169
-
170
-
171
-
172
-
173
-
174
-
175
-
176
-
177
-
178
-
179
-
180
-
181
-
182
-
183
-
184
-
185
-
186
-
187
-
188
-
189
-
190
-
191
-
192
-
193
-
194
-
195
-
196
-
197
-
198
-
199
-
200
-
201
-
202
-
203
-
204
-
205
-
206
-
207
-
208
-
209
-
210
-
211
-
212
-
213
-
214
-
215
-
216
-
217
-
218
-
219
-
220
-
221
-
222
-
223
-
224
-
225
-
226
-
227
-
228
-
229
-
230
-
231
-
232
-
233
-
234
-
235
-
236
-
237
-
238
-
239
-
240
-
241
-
242
-
243
-
244
-
245
-
246
-
247
-
248
-
249
-
250
-
251
-
252
-
253
-
254
-
255
-
256
-
257
-
258
-
259
-
260
-
261
-
262
-
263
-
264
-
265
-
266
-
267
-
268
-
269
-
270
-
271
-
272
-
273
-
274
-
275
-
276
-
277
-
278
-
279
-
280
-
281
-
282
-
283
-
284
-
285
-
286
-
287
-
288
-
289
-
290
-
291
-
292
-
293
-
294
-
295
-
296
-
297
-
298
-
299
-
300
 |
 |
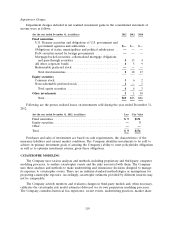
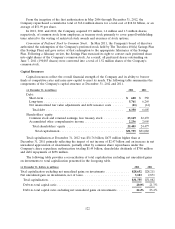
Investing Activities
Net cash flows used by investing activities in 2012 were $972 million, compared with net cash flows
provided by investing activities of $1.15 billion and $2.11 billion in 2011 and 2010, respectively. The
Company’s consolidated total investments at December 31, 2012 increased by $1.14 billion from
year-end 2011, driven by operating cash flows of $3.23 billion and a $362 million increase in net pretax
unrealized appreciation of investments in 2012, partially offset by the impact of the Company’s common
share repurchases of $1.47 billion under its share repurchase authorization, common shareholder
dividends of $694 million and debt repayments of $258 million.
On December 5, 2012, the Company increased its ownership in J. Malucelli Participa¸c˜
oes em
Seguros e Resseguros S.A, its Brazilian joint venture (JMalucelli), through the exercise of a pre-existing
option. As a result, the Company increased its ownership to 49.5% of the venture. JMalucelli is
currently the market leader in surety in Brazil based on market share. The Company’s investment was
funded with cash provided internally from an operating subsidiary of the Company.
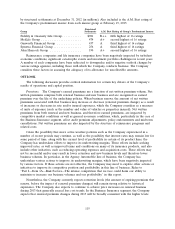
The Company’s investment portfolio is managed to support its insurance operations; accordingly,
the portfolio is positioned to meet obligations to policyholders. As such, the primary goals of the
Company’s asset-liability management process are to satisfy the insurance liabilities and maintain
sufficient liquidity to cover fluctuations in projected liability cash flows. Generally, the expected
principal and interest payments produced by the Company’s fixed maturity portfolio adequately fund
the estimated runoff of the Company’s insurance reserves. Although this is not an exact cash flow
match in each period, the substantial amount by which the market value of the fixed maturity portfolio
exceeds the value of the net insurance liabilities, as well as the positive cash flow from newly sold
policies and the large amount of high quality liquid bonds, contributes to the Company’s ability to fund
claim payments without having to sell illiquid assets or access credit facilities.
Financing Activities
Net cash flows used in financing activities were $2.15 billion, $3.31 billion and $5.22 billion in 2012,
2011 and 2010, respectively. The totals in each year reflected common share repurchases, dividends to
shareholders and the repayment of debt, partially offset by the proceeds from employee stock option
exercises and, in 2010, the issuance of debt.
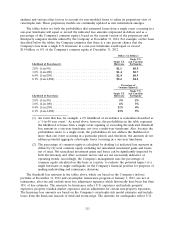
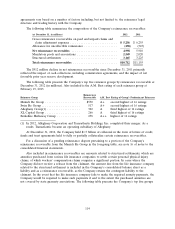
Debt Transactions.
2012. On May 29, 2012, the Company purchased and retired $8.5 million aggregate principal
amount of its 6.25% fixed-to-floating rate junior subordinated debentures due March 15, 2067 in an
open market transaction. The Company’s $250 million, 5.375% senior notes matured on June 15, 2012
and were paid from existing holding company liquidity.
2011. On June 1, 2011, the Company repaid the remaining $9 million principal balance on its
7.22% real estate non-recourse debt.
2010. On November 1, 2010, the Company issued $500 million aggregate principal amount 3.90%
senior notes that will mature on November 1, 2020, and $750 million aggregate principal amount 5.35%
senior notes that will mature on November 1, 2040. The net proceeds of these issuances, after original
issuance discount and the deduction of underwriting expenses and commissions and other expenses,
were approximately $496 million and $738 million, respectively. Interest on the senior notes is payable
semi-annually in arrears on November 1 and May 1 of each year. The senior notes are redeemable in
whole at any time or in part from time to time, at the Company’s option, at a redemption price equal
to the greater of (a) 100% of the principal amount of senior notes to be redeemed or (b) the sum of
the present values of the remaining scheduled payments of principal and interest on the senior notes to
be redeemed (exclusive of interest accrued to the date of redemption) discounted to the date of
redemption on a semi-annual basis (assuming a 360-day year consisting of twelve 30-day months) at the
120