Travelers 2012 Annual Report Download - page 203
Download and view the complete annual report
Please find page 203 of the 2012 Travelers annual report below. You can navigate through the pages in the report by either clicking on the pages listed below, or by using the keyword search tool below to find specific information within the annual report.-
 1
1 -
2
-
3
-
4
-
5
-
6
-
7
-
8
-
9
-
10
-
11
-
12
-
13
-
14
-
15
-
16
-
17
-
18
-
19
-
20
-
21
-
22
-
23
-
24
-
25
-
26
-
27
-
28
-
29
-
30
-
31
-
32
-
33
-
34
-
35
-
36
-
37
-
38
-
39
-
40
-
41
-
42
-
43
-
44
-
45
-
46
-
47
-
48
-
49
-
50
-
51
-
52
-
53
-
54
-
55
-
56
-
57
-
58
-
59
-
60
-
61
-
62
-
63
-
64
-
65
-
66
-
67
-
68
-
69
-
70
-
71
-
72
-
73
-
74
-
75
-
76
-
77
-
78
-
79
-
80
-
81
-
82
-
83
-
84
-
85
-
86
-
87
-
88
-
89
-
90
-
91
-
92
-
93
-
94
-
95
-
96
-
97
-
98
-
99
-
100
-
101
-
102
-
103
-
104
-
105
-
106
-
107
-
108
-
109
-
110
-
111
-
112
-
113
-
114
-
115
-
116
-
117
-
118
-
119
-
120
-
121
-
122
-
123
-
124
-
125
-
126
-
127
-
128
-
129
-
130
-
131
-
132
-
133
-
134
-
135
-
136
-
137
-
138
-
139
-
140
-
141
-
142
-
143
-
144
-
145
-
146
-
147
-
148
-
149
-
150
-
151
-
152
-
153
-
154
-
155
-
156
-
157
-
158
-
159
-
160
-
161
-
162
-
163
-
164
-
165
-
166
-
167
-
168
-
169
-
170
-
171
-
172
-
173
-
174
-
175
-
176
-
177
-
178
-
179
-
180
-
181
-
182
-
183
-
184
-
185
-
186
-
187
-
188
-
189
-
190
-
191
-
192
-
 193
193 -
 194
194 -
 195
195 -
 196
196 -
 197
197 -
 198
198 -
 199
199 -
 200
200 -
 201
201 -
 202
202 -
 203
203 -
 204
204 -
 205
205 -
 206
206 -
 207
207 -
 208
208 -
 209
209 -
 210
210 -
 211
211 -
 212
212 -
 213
213 -
214
-
215
-
216
-
217
-
218
-
219
-
220
-
221
-
222
-
223
-
224
-
225
-
226
-
227
-
228
-
229
-
230
-
231
-
232
-
233
-
234
-
235
-
236
-
237
-
238
-
239
-
240
-
241
-
242
-
243
-
244
-
245
-
246
-
247
-
248
-
249
-
250
-
251
-
252
-
253
-
254
-
255
-
256
-
257
-
258
-
259
-
260
-
261
-
262
-
263
-
264
-
265
-
266
-
267
-
268
-
269
-
270
-
271
-
272
-
273
-
274
-
275
-
276
-
277
-
278
-
279
-
280
-
281
-
282
-
283
-
284
-
285
-
286
-
287
-
288
-
289
-
290
-
291
-
292
-
293
-
294
-
295
-
296
-
297
-
298
-
299
-
300
 |
 |

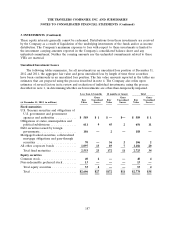
THE TRAVELERS COMPANIES, INC. AND SUBSIDIARIES
NOTES TO CONSOLIDATED FINANCIAL STATEMENTS (Continued)
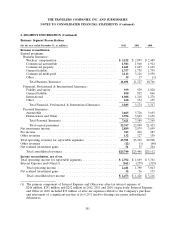
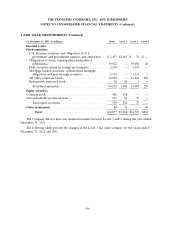
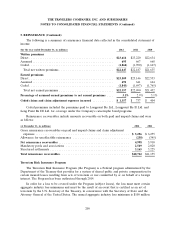
3. INVESTMENTS (Continued)
Changes in net unrealized gains on investment securities that are included as a separate
component of other comprehensive income were as follows:
(at and for the year ended December 31, in millions) 2012 2011 2010
Changes in net unrealized investment gains
Fixed maturities ............................... $ 326 $1,588 $ 114
Equity securities ............................... 38 (2) 69
Other investments ............................. (2) (14) (178)
362 1,572 5
Related tax expense ............................ 130 560 2
Change in net unrealized gain on investment securities . 232 1,012 3
Balance, beginning of year ....................... 2,871 1,859 1,856
Balance, end of year .......................... $3,103 $2,871 $1,859
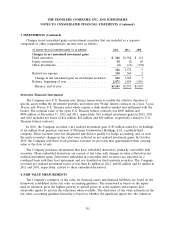
Derivative Financial Instruments
The Company uses U.S. Treasury note futures transactions to modify the effective duration of
specific assets within the investment portfolio and enters into 90-day futures contracts on 2-year, 5-year,
10-year and 30-year U.S. Treasury notes which require a daily mark-to-market and settlement with the
broker. The notional value of the open U.S. Treasury futures contracts was $800 million and
$900 million at December 31, 2012 and 2011, respectively. Net realized investment gains in 2012, 2011
and 2010 included net losses of $14 million, $62 million and $30 million, respectively, related to U.S.
Treasury futures contracts.
In 2010, the Company recorded a net realized investment gain of $5 million related to its holdings
of six million stock purchase warrants of Platinum Underwriters Holdings, Ltd., a publicly-held
company. These warrants were not designated and did not qualify for hedge accounting, and, as such,
the mark-to-market changes in fair value were reflected in net realized investment gains. In October
2010, the Company sold these stock purchase warrants for proceeds that approximated their carrying
value at the date of sale.
The Company purchases investments that have embedded derivatives, primarily convertible debt
securities. These embedded derivatives are carried at fair value with changes in value reflected in net
realized investment gains. Derivatives embedded in convertible debt securities are reported on a
combined basis with their host instrument and are classified as fixed maturity securities. The Company
recorded net realized investment losses of less than $1 million in 2012, and $2 million and $1 million in
2011 and 2010, respectively, related to these embedded derivatives.
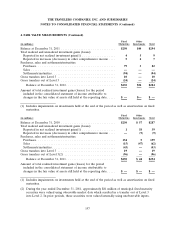
4. FAIR VALUE MEASUREMENTS
The Company’s estimates of fair value for financial assets and financial liabilities are based on the
framework established in the fair value accounting guidance. The framework is based on the inputs
used in valuation, gives the highest priority to quoted prices in active markets and requires that
observable inputs be used in the valuations when available. The disclosure of fair value estimates in the
fair value accounting guidance hierarchy is based on whether the significant inputs into the valuation
191