Travelers 2012 Annual Report Download - page 285
Download and view the complete annual report
Please find page 285 of the 2012 Travelers annual report below. You can navigate through the pages in the report by either clicking on the pages listed below, or by using the keyword search tool below to find specific information within the annual report.-
 1
1 -
2
-
3
-
4
-
5
-
6
-
7
-
8
-
9
-
10
-
11
-
12
-
13
-
14
-
15
-
16
-
17
-
18
-
19
-
20
-
21
-
22
-
23
-
24
-
25
-
26
-
27
-
28
-
29
-
30
-
31
-
32
-
33
-
34
-
35
-
36
-
37
-
38
-
39
-
40
-
41
-
42
-
43
-
44
-
45
-
46
-
47
-
48
-
49
-
50
-
51
-
52
-
53
-
54
-
55
-
56
-
57
-
58
-
59
-
60
-
61
-
62
-
63
-
64
-
65
-
66
-
67
-
68
-
69
-
70
-
71
-
72
-
73
-
74
-
75
-
76
-
77
-
78
-
79
-
80
-
81
-
82
-
83
-
84
-
85
-
86
-
87
-
88
-
89
-
90
-
91
-
92
-
93
-
94
-
95
-
96
-
97
-
98
-
99
-
100
-
101
-
102
-
103
-
104
-
105
-
106
-
107
-
108
-
109
-
110
-
111
-
112
-
113
-
114
-
115
-
116
-
117
-
118
-
119
-
120
-
121
-
122
-
123
-
124
-
125
-
126
-
127
-
128
-
129
-
130
-
131
-
132
-
133
-
134
-
135
-
136
-
137
-
138
-
139
-
140
-
141
-
142
-
143
-
144
-
145
-
146
-
147
-
148
-
149
-
150
-
151
-
152
-
153
-
154
-
155
-
156
-
157
-
158
-
159
-
160
-
161
-
162
-
163
-
164
-
165
-
166
-
167
-
168
-
169
-
170
-
171
-
172
-
173
-
174
-
175
-
176
-
177
-
178
-
179
-
180
-
181
-
182
-
183
-
184
-
185
-
186
-
187
-
188
-
189
-
190
-
191
-
192
-
193
-
194
-
195
-
196
-
197
-
198
-
199
-
200
-
201
-
202
-
203
-
204
-
205
-
206
-
207
-
208
-
209
-
210
-
211
-
212
-
213
-
214
-
215
-
216
-
217
-
218
-
219
-
220
-
221
-
222
-
223
-
224
-
225
-
226
-
227
-
228
-
229
-
230
-
231
-
232
-
233
-
234
-
235
-
236
-
237
-
238
-
239
-
240
-
241
-
242
-
243
-
244
-
245
-
246
-
247
-
248
-
249
-
250
-
251
-
252
-
253
-
254
-
255
-
256
-
257
-
258
-
259
-
260
-
261
-
262
-
263
-
264
-
265
-
266
-
267
-
268
-
269
-
270
-
271
-
272
-
273
-
274
-
 275
275 -
 276
276 -
 277
277 -
 278
278 -
 279
279 -
 280
280 -
 281
281 -
 282
282 -
 283
283 -
 284
284 -
 285
285 -
 286
286 -
 287
287 -
 288
288 -
 289
289 -
 290
290 -
 291
291 -
 292
292 -
 293
293 -
 294
294 -
 295
295 -
296
-
297
-
298
-
299
-
300
 |
 |

273
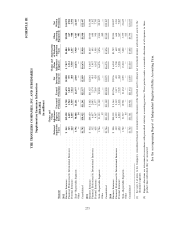
SCHEDULE III
THE TRAVELERS COMPANIES, INC. AND SUBSIDIARIES
Supplementary Insurance Information
2010-2012
(in millions)
Claims and
Claim Claims and Amortization
Deferred Adjustment Net Claim of Deferred Other Net
Acquisition Expense Unearned Earned Investment Adjustment Acquisition Operating Written
Segment Costs Reserves Premiums Premiums Income(1) Expenses Costs Expenses(2) Premiums
2012
Business Insurance .......................... $ 843 $39,598 $ 5,728 $11,691 $2,090 $ 7,857 $1,884 $2,020 $11,872
Financial, Professional & International Insurance ...... 325 6,445 1,964 3,045 395 1,314 589 667 2,981
Personal Insurance .......................... 624 4,845 3,549 7,621 404 5,505 1,437 900 7,594
Total—Reportable Segments .................... 1,792 50,888 11,241 22,357 2,889 14,676 3,910 3,587 22,447
Other .................................. — 34 — — — — — 401 —
Consolidated ............................. $1,792 $50,922 $11,241 $22,357 $2,889 $14,676 $3,910 $3,988 $22,447
2011
Business Insurance .......................... $ 816 $40,129 $ 5,482 $11,327 $2,041 $ 8,447 $1,815 $1,944 $11,340
Financial, Professional & International Insurance ...... 332 6,857 2,043 3,174 414 1,487 603 648 3,102
Personal Insurance .......................... 638 4,367 3,577 7,589 424 6,342 1,458 908 7,745
Total—Reportable Segments .................... 1,786 51,353 11,102 22,090 2,879 16,276 3,876 3,500 22,187
Other .................................. — 39 — — — — — 442 —
Consolidated ............................. $1,786 $51,392 $11,102 $22,090 $2,879 $16,276 $3,876 $3,942 $22,187
2010
Business Insurance .......................... $ 806 $40,318 $ 5,364 $10,766 $2,156 $ 6,504 $1,749 $1,904 $10,857
Financial, Professional & International Insurance ...... 352 6,999 2,139 3,317 439 1,700 612 608 3,211
Personal Insurance .......................... 624 4,220 3,418 7,349 464 5,006 1,441 867 7,567
Total—Reportable Segments .................... 1,782 51,537 10,921 21,432 3,059 13,210 3,802 3,379 21,635
Other .................................. — 44 — — — — — 415 —
Consolidated ............................. $1,782 $51,581 $10,921 $21,432 $3,059 $13,210 $3,802 $3,794 $21,635
(1) See note 2 of notes to the Company’s consolidated financial statements for discussion of the method used to allocate net investment income and invested assets to the
identified segments.
(2) Expense allocations are determined in accordance with prescribed statutory accounting practices. These practices make a reasonable allocation of all expenses to those
product lines with which they are associated.
See the accompanying Report of Independent Registered Public Accounting Firm.