Travelers 2012 Annual Report Download - page 116
Download and view the complete annual report
Please find page 116 of the 2012 Travelers annual report below. You can navigate through the pages in the report by either clicking on the pages listed below, or by using the keyword search tool below to find specific information within the annual report.-
 1
1 -
2
-
3
-
4
-
5
-
6
-
7
-
8
-
9
-
10
-
11
-
12
-
13
-
14
-
15
-
16
-
17
-
18
-
19
-
20
-
21
-
22
-
23
-
24
-
25
-
26
-
27
-
28
-
29
-
30
-
31
-
32
-
33
-
34
-
35
-
36
-
37
-
38
-
39
-
40
-
41
-
42
-
43
-
44
-
45
-
46
-
47
-
48
-
49
-
50
-
51
-
52
-
53
-
54
-
55
-
56
-
57
-
58
-
59
-
60
-
61
-
62
-
63
-
64
-
65
-
66
-
67
-
68
-
69
-
70
-
71
-
72
-
73
-
74
-
75
-
76
-
77
-
78
-
79
-
80
-
81
-
82
-
83
-
84
-
85
-
86
-
87
-
88
-
89
-
90
-
91
-
92
-
93
-
94
-
95
-
96
-
97
-
98
-
99
-
100
-
101
-
102
-
103
-
104
-
105
-
 106
106 -
 107
107 -
 108
108 -
 109
109 -
 110
110 -
 111
111 -
 112
112 -
 113
113 -
 114
114 -
 115
115 -
 116
116 -
 117
117 -
 118
118 -
 119
119 -
 120
120 -
 121
121 -
 122
122 -
 123
123 -
 124
124 -
 125
125 -
 126
126 -
127
-
128
-
129
-
130
-
131
-
132
-
133
-
134
-
135
-
136
-
137
-
138
-
139
-
140
-
141
-
142
-
143
-
144
-
145
-
146
-
147
-
148
-
149
-
150
-
151
-
152
-
153
-
154
-
155
-
156
-
157
-
158
-
159
-
160
-
161
-
162
-
163
-
164
-
165
-
166
-
167
-
168
-
169
-
170
-
171
-
172
-
173
-
174
-
175
-
176
-
177
-
178
-
179
-
180
-
181
-
182
-
183
-
184
-
185
-
186
-
187
-
188
-
189
-
190
-
191
-
192
-
193
-
194
-
195
-
196
-
197
-
198
-
199
-
200
-
201
-
202
-
203
-
204
-
205
-
206
-
207
-
208
-
209
-
210
-
211
-
212
-
213
-
214
-
215
-
216
-
217
-
218
-
219
-
220
-
221
-
222
-
223
-
224
-
225
-
226
-
227
-
228
-
229
-
230
-
231
-
232
-
233
-
234
-
235
-
236
-
237
-
238
-
239
-
240
-
241
-
242
-
243
-
244
-
245
-
246
-
247
-
248
-
249
-
250
-
251
-
252
-
253
-
254
-
255
-
256
-
257
-
258
-
259
-
260
-
261
-
262
-
263
-
264
-
265
-
266
-
267
-
268
-
269
-
270
-
271
-
272
-
273
-
274
-
275
-
276
-
277
-
278
-
279
-
280
-
281
-
282
-
283
-
284
-
285
-
286
-
287
-
288
-
289
-
290
-
291
-
292
-
293
-
294
-
295
-
296
-
297
-
298
-
299
-
300
 |
 |

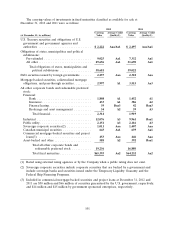
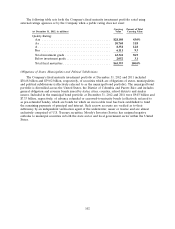
The following table displays the funding sources for the $11.48 billion of municipal bonds
identified as revenue bonds in the foregoing table at December 31, 2012.
Carrying Average Credit
(at December 31, 2012, in millions) Value Quality(1)
Source:
Water and sewer ............................... $ 3,886 Aaa/Aa1
Higher education .............................. 1,824 Aaa/Aa1
Transportation ................................ 1,169 Aa1
Power and utilities ............................. 1,071 Aa2
Special tax ................................... 883 Aa1
Lease ....................................... 536 Aa2
Government funded/grant revenue .................. 139 Aaa
Healthcare ................................... 98 Aa2
Housing ..................................... 97 Aaa/Aa1
General fund ................................. 61 Aa3
Industrial revenue .............................. 51 A1
Property tax .................................. 33 Aa2
Other revenue sources .......................... 1,636 Aaa/Aa1
Total ..................................... $11,484 Aa1
(1) Rated using external rating agencies or by the Company when a public rating does not
exist.
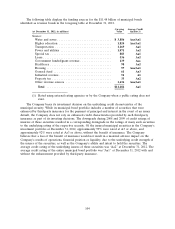
The Company bases its investment decision on the underlying credit characteristics of the
municipal security. While its municipal bond portfolio includes a number of securities that were
enhanced by third-party insurance for the payment of principal and interest in the event of an issuer
default, the Company does not rely on enhanced credit characteristics provided by such third-party
insurance as part of its investing decisions. The downgrade during 2008 and 2009 of credit ratings of
insurers of these securities resulted in a corresponding downgrade in the ratings of many such securities
to the underlying rating of the respective security. Of the insured municipal securities in the Company’s
investment portfolio at December 31, 2012, approximately 99% were rated at A3 or above, and
approximately 92% were rated at Aa3 or above, without the benefit of insurance. The Company
believes that a loss of the benefit of insurance would not result in a material adverse impact on the
Company’s results of operations, financial position or liquidity, due to the underlying credit strength of
the issuers of the securities, as well as the Company’s ability and intent to hold the securities. The
average credit rating of the underlying issuers of these securities was ‘‘Aa2’’ at December 31, 2012. The
average credit rating of the entire municipal bond portfolio was ‘‘Aa1’’ at December 31, 2012 with and
without the enhancement provided by third-party insurance.
104