Travelers 2012 Annual Report Download - page 118
Download and view the complete annual report
Please find page 118 of the 2012 Travelers annual report below. You can navigate through the pages in the report by either clicking on the pages listed below, or by using the keyword search tool below to find specific information within the annual report.-
 1
1 -
2
-
3
-
4
-
5
-
6
-
7
-
8
-
9
-
10
-
11
-
12
-
13
-
14
-
15
-
16
-
17
-
18
-
19
-
20
-
21
-
22
-
23
-
24
-
25
-
26
-
27
-
28
-
29
-
30
-
31
-
32
-
33
-
34
-
35
-
36
-
37
-
38
-
39
-
40
-
41
-
42
-
43
-
44
-
45
-
46
-
47
-
48
-
49
-
50
-
51
-
52
-
53
-
54
-
55
-
56
-
57
-
58
-
59
-
60
-
61
-
62
-
63
-
64
-
65
-
66
-
67
-
68
-
69
-
70
-
71
-
72
-
73
-
74
-
75
-
76
-
77
-
78
-
79
-
80
-
81
-
82
-
83
-
84
-
85
-
86
-
87
-
88
-
89
-
90
-
91
-
92
-
93
-
94
-
95
-
96
-
97
-
98
-
99
-
100
-
101
-
102
-
103
-
104
-
105
-
106
-
107
-
 108
108 -
 109
109 -
 110
110 -
 111
111 -
 112
112 -
 113
113 -
 114
114 -
 115
115 -
 116
116 -
 117
117 -
 118
118 -
 119
119 -
 120
120 -
 121
121 -
 122
122 -
 123
123 -
 124
124 -
 125
125 -
 126
126 -
 127
127 -
 128
128 -
129
-
130
-
131
-
132
-
133
-
134
-
135
-
136
-
137
-
138
-
139
-
140
-
141
-
142
-
143
-
144
-
145
-
146
-
147
-
148
-
149
-
150
-
151
-
152
-
153
-
154
-
155
-
156
-
157
-
158
-
159
-
160
-
161
-
162
-
163
-
164
-
165
-
166
-
167
-
168
-
169
-
170
-
171
-
172
-
173
-
174
-
175
-
176
-
177
-
178
-
179
-
180
-
181
-
182
-
183
-
184
-
185
-
186
-
187
-
188
-
189
-
190
-
191
-
192
-
193
-
194
-
195
-
196
-
197
-
198
-
199
-
200
-
201
-
202
-
203
-
204
-
205
-
206
-
207
-
208
-
209
-
210
-
211
-
212
-
213
-
214
-
215
-
216
-
217
-
218
-
219
-
220
-
221
-
222
-
223
-
224
-
225
-
226
-
227
-
228
-
229
-
230
-
231
-
232
-
233
-
234
-
235
-
236
-
237
-
238
-
239
-
240
-
241
-
242
-
243
-
244
-
245
-
246
-
247
-
248
-
249
-
250
-
251
-
252
-
253
-
254
-
255
-
256
-
257
-
258
-
259
-
260
-
261
-
262
-
263
-
264
-
265
-
266
-
267
-
268
-
269
-
270
-
271
-
272
-
273
-
274
-
275
-
276
-
277
-
278
-
279
-
280
-
281
-
282
-
283
-
284
-
285
-
286
-
287
-
288
-
289
-
290
-
291
-
292
-
293
-
294
-
295
-
296
-
297
-
298
-
299
-
300
 |
 |

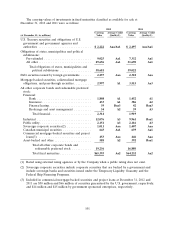
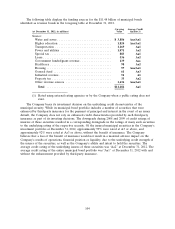
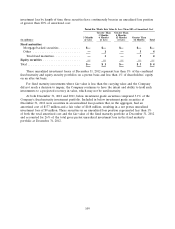
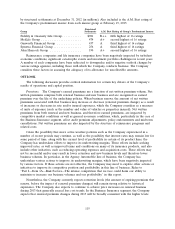
corporate securities (comprised of industrial corporations and utility companies) which could be
affected if economic conditions deteriorated due to a prolonged recession.
Debt Securities Corporate Securities
Issued
by Foreign Sovereign
Governments Financial Corporates All Other
Average Average Average Average
Carrying Credit Carrying Credit Carrying Credit Carrying Credit
(at December 31, 2012, in millions) Value Quality(1) Value Quality(1) Value Quality(1) Value Quality(1)
Eurozone Periphery
Spain ................... $ — — $ 14 Baa3 $ — — $ 36 Baa1
Ireland .................. ——2A3——61A3
Italy .................... — — — — — — 23 Baa2
Greece .................. — — — — — — 13 Baa2
Portugal ................. ————————
Subtotal ................ — 16 — 133
Eurozone Non-Periphery
Germany ................. 70 Aaa 7 A2 490 Aaa 223 A3
France .................. 36 Aaa/Aa1 28 A2 — — 379 A1
Netherlands .............. — — 54 Aa3 126 Aaa 249 A2
Austria .................. — — — — 43 Aa2 — —
Finland .................. 18 Aaa — — — — 13 Baa3
Belgium ................. — — — — — — 142 A3
Luxembourg .............. — — — — — — 47 Baa1
Subtotal ................ 124 89 659 1,053
Total ................ $124 $105 $659 $1,186
(1) Rated using external rating agencies or by the Company when a public rating does not exist. The
table includes $225 million of short-term securities which have the highest ratings issued by
external rating agencies for short-term issuances. For purposes of this table, the short-term
securities, which are rated ‘‘A-1+’’ and/or ‘‘P-1,’’ are included as ‘‘Aaa’’ rated securities.
In January 2012, Standard & Poor’s downgraded the sovereign ratings of nine Eurozone countries,
including France (from ‘‘AAA’’ to ‘‘AA’’). In November 2012, Moody’s downgraded the sovereign
rating of France from ‘‘Aaa’’ to ‘‘Aa1.’’
In addition to fixed maturities noted in the foregoing table, the Company has exposure totaling
$276 million to private equity limited partnerships and real estate partnerships (both of which are
included in other investments in the Company’s consolidated balance sheet) whose primary investing
focus is across Europe. The Company has unfunded commitments totaling $145 million to these
partnerships. The Company also has $4 million of nonredeemable preferred stock (included in equity
securities on the Company’s consolidated balance sheet) issued by companies in the Eurozone.
Mortgage-Backed Securities, Collateralized Mortgage Obligations and Pass-Through Securities
The Company’s fixed maturity investment portfolio at December 31, 2012 and 2011 included
$3.00 billion and $3.52 billion, respectively, of residential mortgage-backed securities including
pass-through-securities and collateralized mortgage obligations (CMO), all of which are subject to
prepayment risk (either shortening or lengthening of duration). While prepayment risk for securities
and its effect on income cannot be fully controlled, particularly when interest rates move dramatically,
the Company’s investment strategy generally favors securities that reduce this risk within expected
106