Travelers 2012 Annual Report Download - page 88
Download and view the complete annual report
Please find page 88 of the 2012 Travelers annual report below. You can navigate through the pages in the report by either clicking on the pages listed below, or by using the keyword search tool below to find specific information within the annual report.-
 1
1 -
2
-
3
-
4
-
5
-
6
-
7
-
8
-
9
-
10
-
11
-
12
-
13
-
14
-
15
-
16
-
17
-
18
-
19
-
20
-
21
-
22
-
23
-
24
-
25
-
26
-
27
-
28
-
29
-
30
-
31
-
32
-
33
-
34
-
35
-
36
-
37
-
38
-
39
-
40
-
41
-
42
-
43
-
44
-
45
-
46
-
47
-
48
-
49
-
50
-
51
-
52
-
53
-
54
-
55
-
56
-
57
-
58
-
59
-
60
-
61
-
62
-
63
-
64
-
65
-
66
-
67
-
68
-
69
-
70
-
71
-
72
-
73
-
74
-
75
-
76
-
77
-
 78
78 -
 79
79 -
 80
80 -
 81
81 -
 82
82 -
 83
83 -
 84
84 -
 85
85 -
 86
86 -
 87
87 -
 88
88 -
 89
89 -
 90
90 -
 91
91 -
 92
92 -
 93
93 -
 94
94 -
 95
95 -
 96
96 -
 97
97 -
 98
98 -
99
-
100
-
101
-
102
-
103
-
104
-
105
-
106
-
107
-
108
-
109
-
110
-
111
-
112
-
113
-
114
-
115
-
116
-
117
-
118
-
119
-
120
-
121
-
122
-
123
-
124
-
125
-
126
-
127
-
128
-
129
-
130
-
131
-
132
-
133
-
134
-
135
-
136
-
137
-
138
-
139
-
140
-
141
-
142
-
143
-
144
-
145
-
146
-
147
-
148
-
149
-
150
-
151
-
152
-
153
-
154
-
155
-
156
-
157
-
158
-
159
-
160
-
161
-
162
-
163
-
164
-
165
-
166
-
167
-
168
-
169
-
170
-
171
-
172
-
173
-
174
-
175
-
176
-
177
-
178
-
179
-
180
-
181
-
182
-
183
-
184
-
185
-
186
-
187
-
188
-
189
-
190
-
191
-
192
-
193
-
194
-
195
-
196
-
197
-
198
-
199
-
200
-
201
-
202
-
203
-
204
-
205
-
206
-
207
-
208
-
209
-
210
-
211
-
212
-
213
-
214
-
215
-
216
-
217
-
218
-
219
-
220
-
221
-
222
-
223
-
224
-
225
-
226
-
227
-
228
-
229
-
230
-
231
-
232
-
233
-
234
-
235
-
236
-
237
-
238
-
239
-
240
-
241
-
242
-
243
-
244
-
245
-
246
-
247
-
248
-
249
-
250
-
251
-
252
-
253
-
254
-
255
-
256
-
257
-
258
-
259
-
260
-
261
-
262
-
263
-
264
-
265
-
266
-
267
-
268
-
269
-
270
-
271
-
272
-
273
-
274
-
275
-
276
-
277
-
278
-
279
-
280
-
281
-
282
-
283
-
284
-
285
-
286
-
287
-
288
-
289
-
290
-
291
-
292
-
293
-
294
-
295
-
296
-
297
-
298
-
299
-
300
 |
 |

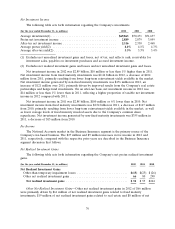
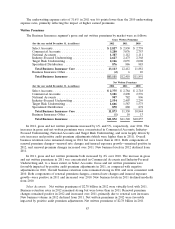
Net Investment Income
The following table sets forth information regarding the Company’s investments.
(for the year ended December 31, in millions) 2012 2011 2010
Average investments(1) ..................................... $69,863 $70,471 $71,637
Pretax net investment income ................................ 2,889 2,879 3,059
After-tax net investment income .............................. 2,316 2,330 2,468
Average pretax yield(2) .................................... 4.1% 4.1% 4.3%
Average after-tax yield(2) ................................... 3.3% 3.3% 3.4%
(1) Excludes net unrealized investment gains and losses, net of tax, and reflects cash, receivables for
investment sales, payables on investment purchases and accrued investment income.
(2) Excludes net realized investment gains and losses and net unrealized investment gains and losses.
Net investment income in 2012 was $2.89 billion, $10 million or less than 1% higher than in 2011.
Net investment income from fixed maturity investments was $2.44 billion in 2012, a decrease of $104
million from 2011, primarily resulting from lower long-term reinvestment yields available in the market.
Net investment income generated by non-fixed maturity investments was $476 million in 2012, an
increase of $121 million over 2011, primarily driven by improved results from the Company’s real estate
partnerships and hedge fund investments. On an after-tax basis, net investment income in 2012 was
$14 million or less than 1% lower than in 2011, reflecting a higher proportion of taxable net investment
income in 2012 compared with 2011.
Net investment income in 2011 was $2.88 billion, $180 million or 6% lower than in 2010. Net
investment income from fixed maturity investments was $2.54 billion in 2011, a decrease of $167 million
from 2010, primarily resulting from lower long-term reinvestment yields available in the market, as well
as lower average levels of fixed maturity invested assets due to the Company’s common share
repurchases. Net investment income generated by non-fixed maturity investments was $355 million in
2011, a decrease of $15 million from 2010.
Fee Income
The National Accounts market in the Business Insurance segment is the primary source of the
Company’s fee-based business. The $27 million and $9 million increases in fee income in 2012 and
2011, respectively, compared with the respective prior years are described in the Business Insurance
segment discussion that follows.
Net Realized Investment Gains
The following table sets forth information regarding the Company’s net pretax realized investment
gains.
(for the year ended December 31, in millions) 2012 2011 2010
Net Realized Investment Gains
Other-than-temporary impairment losses ............................. $(15) $(25) $(26)
Other net realized investment gains ................................. 66 80 290
Net realized investment gains ................................... $51 $ 55 $264
Other Net Realized Investment Gains—Other net realized investment gains in 2012 of $66 million
were primarily driven by $61 million of net realized investment gains related to fixed maturity
investments, $19 million of net realized investment gains related to real estate and $8 million of net
76