Travelers 2012 Annual Report Download - page 95
Download and view the complete annual report
Please find page 95 of the 2012 Travelers annual report below. You can navigate through the pages in the report by either clicking on the pages listed below, or by using the keyword search tool below to find specific information within the annual report.-
 1
1 -
2
-
3
-
4
-
5
-
6
-
7
-
8
-
9
-
10
-
11
-
12
-
13
-
14
-
15
-
16
-
17
-
18
-
19
-
20
-
21
-
22
-
23
-
24
-
25
-
26
-
27
-
28
-
29
-
30
-
31
-
32
-
33
-
34
-
35
-
36
-
37
-
38
-
39
-
40
-
41
-
42
-
43
-
44
-
45
-
46
-
47
-
48
-
49
-
50
-
51
-
52
-
53
-
54
-
55
-
56
-
57
-
58
-
59
-
60
-
61
-
62
-
63
-
64
-
65
-
66
-
67
-
68
-
69
-
70
-
71
-
72
-
73
-
74
-
75
-
76
-
77
-
78
-
79
-
80
-
81
-
82
-
83
-
84
-
 85
85 -
 86
86 -
 87
87 -
 88
88 -
 89
89 -
 90
90 -
 91
91 -
 92
92 -
 93
93 -
 94
94 -
 95
95 -
 96
96 -
 97
97 -
 98
98 -
 99
99 -
 100
100 -
 101
101 -
 102
102 -
 103
103 -
 104
104 -
 105
105 -
106
-
107
-
108
-
109
-
110
-
111
-
112
-
113
-
114
-
115
-
116
-
117
-
118
-
119
-
120
-
121
-
122
-
123
-
124
-
125
-
126
-
127
-
128
-
129
-
130
-
131
-
132
-
133
-
134
-
135
-
136
-
137
-
138
-
139
-
140
-
141
-
142
-
143
-
144
-
145
-
146
-
147
-
148
-
149
-
150
-
151
-
152
-
153
-
154
-
155
-
156
-
157
-
158
-
159
-
160
-
161
-
162
-
163
-
164
-
165
-
166
-
167
-
168
-
169
-
170
-
171
-
172
-
173
-
174
-
175
-
176
-
177
-
178
-
179
-
180
-
181
-
182
-
183
-
184
-
185
-
186
-
187
-
188
-
189
-
190
-
191
-
192
-
193
-
194
-
195
-
196
-
197
-
198
-
199
-
200
-
201
-
202
-
203
-
204
-
205
-
206
-
207
-
208
-
209
-
210
-
211
-
212
-
213
-
214
-
215
-
216
-
217
-
218
-
219
-
220
-
221
-
222
-
223
-
224
-
225
-
226
-
227
-
228
-
229
-
230
-
231
-
232
-
233
-
234
-
235
-
236
-
237
-
238
-
239
-
240
-
241
-
242
-
243
-
244
-
245
-
246
-
247
-
248
-
249
-
250
-
251
-
252
-
253
-
254
-
255
-
256
-
257
-
258
-
259
-
260
-
261
-
262
-
263
-
264
-
265
-
266
-
267
-
268
-
269
-
270
-
271
-
272
-
273
-
274
-
275
-
276
-
277
-
278
-
279
-
280
-
281
-
282
-
283
-
284
-
285
-
286
-
287
-
288
-
289
-
290
-
291
-
292
-
293
-
294
-
295
-
296
-
297
-
298
-
299
-
300
 |
 |

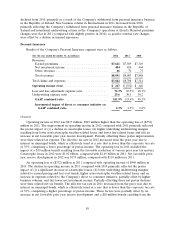
The underwriting expense ratio of 31.6% in 2011 was 0.6 points lower than the 2010 underwriting
expense ratio, primarily reflecting the impact of higher earned premiums.
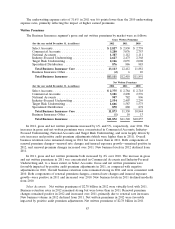
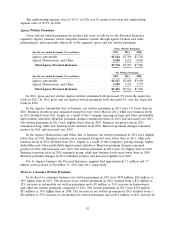
Written Premiums
The Business Insurance segment’s gross and net written premiums by market were as follows:
Gross Written Premiums
(for the year ended December 31, in millions) 2012 2011 2010
Select Accounts ............................. $ 2,827 $ 2,830 $ 2,758
Commercial Accounts ........................ 3,280 3,076 2,753
National Accounts ........................... 1,387 1,112 1,111
Industry-Focused Underwriting .................. 2,627 2,473 2,368
Target Risk Underwriting ...................... 2,116 2,035 2,008
Specialized Distribution ....................... 876 886 883
Total Business Insurance Core ................ 13,113 12,412 11,881
Business Insurance Other ...................... (2) 610
Total Business Insurance .................... $13,111 $12,418 $11,891
Net Written Premiums
(for the year ended December 31, in millions) 2012 2011 2010
Select Accounts ............................. $ 2,775 $ 2,784 $ 2,718
Commercial Accounts ........................ 3,101 2,890 2,576
National Accounts ........................... 907 782 806
Industry-Focused Underwriting .................. 2,554 2,407 2,299
Target Risk Underwriting ...................... 1,666 1,587 1,573
Specialized Distribution ....................... 870 880 872
Total Business Insurance Core ................ 11,873 11,330 10,844
Business Insurance Other ...................... (1) 10 13
Total Business Insurance .................... $11,872 $11,340 $10,857
In 2012, gross and net written premiums increased by 6% and 5%, respectively, over 2011. The
increases in gross and net written premiums were concentrated in Commercial Accounts, Industry-
Focused Underwriting, National Accounts and Target Risk Underwriting, and were largely driven by
rate increases and positive audit premium adjustments (which were higher than in 2011). Overall
business retention rates remained strong in 2012 but were lower than in 2011. Both components of
renewal premium changes—renewal rate changes and insured exposure growth—remained positive in
2012, and renewal premium changes increased over 2011. New business levels in 2012 declined from
2011.
In 2011, gross and net written premiums both increased by 4% over 2010. The increase in gross
and net written premiums in 2011 was concentrated in Commercial Accounts and Industry-Focused
Underwriting and, to a lesser extent, in Select Accounts. Gross and net written premiums were
favorably impacted by positive audit premium adjustments in 2011, as compared with negative
adjustments in 2010. Overall business retention rates remained strong in 2011 and were consistent with
2010. Both components of renewal premium changes—renewal rate changes and insured exposure
growth—were positive in 2011 and increased over 2010. New business levels in 2011 declined modestly
from 2010.
Select Accounts. Net written premiums of $2.78 billion in 2012 were virtually level with 2011.
Business retention rates in 2012 remained strong but were lower than in 2011. Renewal premium
changes remained positive in 2012 and increased over 2011, primarily due to renewal rate increases.
New business volume in 2012 declined from 2011. Net written premiums in 2012 were favorably
impacted by positive audit premium adjustments. Net written premiums of $2.78 billion in 2011
83