Travelers 2012 Annual Report Download - page 2
Download and view the complete annual report
Please find page 2 of the 2012 Travelers annual report below. You can navigate through the pages in the report by either clicking on the pages listed below, or by using the keyword search tool below to find specific information within the annual report.-
 1
1 -
 2
2 -
 3
3 -
 4
4 -
 5
5 -
 6
6 -
 7
7 -
 8
8 -
 9
9 -
 10
10 -
 11
11 -
 12
12 -
 13
13 -
14
-
15
-
16
-
17
-
18
-
19
-
20
-
21
-
22
-
23
-
24
-
25
-
26
-
27
-
28
-
29
-
30
-
31
-
32
-
33
-
34
-
35
-
36
-
37
-
38
-
39
-
40
-
41
-
42
-
43
-
44
-
45
-
46
-
47
-
48
-
49
-
50
-
51
-
52
-
53
-
54
-
55
-
56
-
57
-
58
-
59
-
60
-
61
-
62
-
63
-
64
-
65
-
66
-
67
-
68
-
69
-
70
-
71
-
72
-
73
-
74
-
75
-
76
-
77
-
78
-
79
-
80
-
81
-
82
-
83
-
84
-
85
-
86
-
87
-
88
-
89
-
90
-
91
-
92
-
93
-
94
-
95
-
96
-
97
-
98
-
99
-
100
-
101
-
102
-
103
-
104
-
105
-
106
-
107
-
108
-
109
-
110
-
111
-
112
-
113
-
114
-
115
-
116
-
117
-
118
-
119
-
120
-
121
-
122
-
123
-
124
-
125
-
126
-
127
-
128
-
129
-
130
-
131
-
132
-
133
-
134
-
135
-
136
-
137
-
138
-
139
-
140
-
141
-
142
-
143
-
144
-
145
-
146
-
147
-
148
-
149
-
150
-
151
-
152
-
153
-
154
-
155
-
156
-
157
-
158
-
159
-
160
-
161
-
162
-
163
-
164
-
165
-
166
-
167
-
168
-
169
-
170
-
171
-
172
-
173
-
174
-
175
-
176
-
177
-
178
-
179
-
180
-
181
-
182
-
183
-
184
-
185
-
186
-
187
-
188
-
189
-
190
-
191
-
192
-
193
-
194
-
195
-
196
-
197
-
198
-
199
-
200
-
201
-
202
-
203
-
204
-
205
-
206
-
207
-
208
-
209
-
210
-
211
-
212
-
213
-
214
-
215
-
216
-
217
-
218
-
219
-
220
-
221
-
222
-
223
-
224
-
225
-
226
-
227
-
228
-
229
-
230
-
231
-
232
-
233
-
234
-
235
-
236
-
237
-
238
-
239
-
240
-
241
-
242
-
243
-
244
-
245
-
246
-
247
-
248
-
249
-
250
-
251
-
252
-
253
-
254
-
255
-
256
-
257
-
258
-
259
-
260
-
261
-
262
-
263
-
264
-
265
-
266
-
267
-
268
-
269
-
270
-
271
-
272
-
273
-
274
-
275
-
276
-
277
-
278
-
279
-
280
-
281
-
282
-
283
-
284
-
285
-
286
-
287
-
288
-
289
-
290
-
291
-
292
-
293
-
294
-
295
-
296
-
297
-
298
-
299
-
300
 |
 |

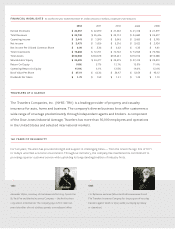
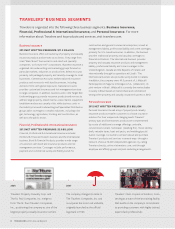
The Travelers Companies Inc NYSE TRV is a leading provider of property and casualty
insurance for auto home and business The company’s diverse business lines off er customers a
wide range of coverage predominantly through independent agents and brokers A component
of the Dow Jones Industrial Average Travelers has more than employees and operations
in the United States and selected international markets
TRAVELERS AT A GLANCE
Alexander Wilkin secretary of the Minnesota Territory founds the
St Paul Fire and Marine Insurance Company the fi rst business
corporation in Minnesota The company pays its fi rst claim two
years later after a fi re at a bakery spreads to an adjacent offi ce
JG Batterson and nine fellow Hartford businessmen found
The Travelers Insurance Company for the purpose of insuring
travelers against death or injury while journeying by railway
or steamboat
For years Travelers has provided strength and support in challenging times from the Great Chicago Fire of
to today’s uncertain economic environment Throughout its history the company has maintained its commitment to
providing superior customer service while upholding its longstanding tradition of industry fi rsts
Earned Premiums
Total Revenues
Operating Income
Net Income
Net Income Per Diluted Common Share
Total Investments
Total Assets
Shareholders’ Equity
Return On Equity % % % % %
Operating Return On Equity % % % % %
Book Value Per Share
Dividends Per Share
FINANCIAL HIGHLIGHTS At and for the year ended December 31. Dollar amounts in millions, except per share amounts.
YEARS OF RELIABILITY