Travelers 2002 Annual Report Download - page 89
Download and view the complete annual report
Please find page 89 of the 2002 Travelers annual report below. You can navigate through the pages in the report by either clicking on the pages listed below, or by using the keyword search tool below to find specific information within the annual report.
Solutions, which have common underwriting, claim and risk control
functions. Commercial Lines also includes our participation in volun-
tary and involuntary pools, referred to as “Pools and Other.”
Although considered specialty businesses as well, our Surety &
Construction operations are under common leadership, which, in
addition to their shared customer base, provides the basis for their
continued combination into one segment.
Our International & Lloyd’s segment consists of the following com-
ponents: our ongoing operations at Lloyd’s, and our ongoing specialty
commercial operations outside of the United States, including our
Global Accounts business center (collectively referred to as “interna-
tional specialties”). Similar to our Specialty Commercial segment, this
segment includes operations that possess dedicated underwriting,
claims and risk control services that require specialized expertise and
focus exclusively on the customers served by respective operations.
This operation is under common executive management and its busi-
ness is generally conducted outside the United States.
Health Care (with the exception of international Health Care) and
Reinsurance continue to be reported as separate segments as they
have been in the past. Our Reinsurance segment includes all reinsur-
ance business written by our reinsurance operation, out of New York
and London. (In the fourth quarter of 2002, we transferred our remain-
ing ongoing reinsurance operations to Platinum Underwriters
Holdings, Ltd., as discussed in more detail in Note 2 to the consoli-
dated financial statements.
Our Other segment includes the results of our runoff operations at
Lloyd’s; Unionamerica, the London-based underwriting unit acquired
as part of our purchase of MMI in 2000; and all other international
runoff lines of business we decided to exit at the end of 2001, consist-
ing of Health Care business in the United Kingdom, Canada and
Ireland, as well as our underwriting operations in Germany, France,
the Netherlands, Argentina, Mexico (excluding surety business),
Spain, Australia, New Zealand, Botswana and South Africa. (In late
2002, we sold our operations in Argentina, Mexico and Spain).These
are international operations through which we are no longer writing
new business, and whose performance assessment and resource
allocation decisions are being made based on the dedicated financial
information reported for this reporting segment where the sole focus
is claims processing.
In 2001, we sold our life insurance operations and in 2000, we sold
our nonstandard auto business. These operations have been
accounted for as discontinued operations for all periods presented
and are not included in our segment data.
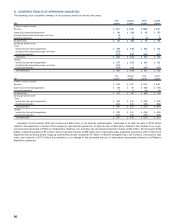
The summary below presents revenues and pretax income from
continuing operations for our reportable segments. The revenues of
our asset management segment include investment income and real-
ized investment gains. The table also presents identifiable assets for
our property-liability underwriting operation in total, and our asset
management segment.
The St. Paul Companies 2002 Annual Report 87
Years ended December 31 2002 2001 2000
(In millions)
REVENUES FROM CONTINUING OPERATIONS
Underwriting:
Specialty Commercial $1,856 $1,410 $ 1,095
Commercial Lines 1,760 1,504 1,387
Surety & Construction 1,141 926 782
International & Lloyd’s 716 590 255
Total ongoing insurance operations 5,473 4,430 3,519
Health Care 474 693 573
Reinsurance 1,071 1,593 1,121
Other 372 580 379
Total run-off insurance operations 1,917 2,866 2,073
Total underwriting 7,390 7,296 5,592
Investment operations:
Net investment income 1,161 1,199 1,247
Realized investment gains (losses) (162) (126) 624
Total investment operations 999 1,073 1,871
Other 116 119 81
Total property-liability insurance 8,505 8,488 7,544
Asset management 397 378 376
Total reportable segments 8,902 8,866 7,920
Parent company, other operations and consolidating eliminations 16 53 26
Total revenues from continuing operations $8,918 $8,919 $ 7,946
INCOME (LOSS) FROM CONTINUING OPERATIONS BEFORE INCOME TAXES AND CUMULATIVE EFFECT OF ACCOUNTING CHANGE
Underwriting:
Specialty Commercial $193 $(14) $ 64
Commercial Lines (331) (16) 84
Surety & Construction (222) (39) 64
International & Lloyd’s 60 (239) (8)
Total ongoing insurance operations (300) (308) 204
Health Care (166) (935) (220)
Reinsurance (22) (726) (115)
Other (221) (325) (178)
Total run-off insurance operations (409) (1,986) (513)
Total underwriting (709) (2,294) (309)
Investment operations:
Net investment income 1,161 1,199 1,247
Realized investment gains (losses) (162) (126) 624
Total investment operations 999 1,073 1,871
Other (46) (179) (95)
Total property-liability insurance 244 (1,400) 1,467
Asset management 162 142 135
Total reportable segments 406 (1,258) 1,602
Parent company, other operations and consolidating eliminations (230) (173) (201)
Total income (loss) from continuing operations before income taxes and cumulative effect of accounting change $176 $(1,431) $ 1,401


