Travelers 2002 Annual Report Download - page 64
Download and view the complete annual report
Please find page 64 of the 2002 Travelers annual report below. You can navigate through the pages in the report by either clicking on the pages listed below, or by using the keyword search tool below to find specific information within the annual report.-
 1
1 -
2
-
3
-
4
-
5
-
6
-
7
-
8
-
9
-
10
-
11
-
12
-
13
-
14
-
15
-
16
-
17
-
18
-
19
-
20
-
21
-
22
-
23
-
24
-
25
-
26
-
27
-
28
-
29
-
30
-
31
-
32
-
33
-
34
-
35
-
36
-
37
-
38
-
39
-
40
-
41
-
42
-
43
-
44
-
45
-
46
-
47
-
48
-
49
-
50
-
51
-
52
-
53
-
 54
54 -
 55
55 -
 56
56 -
 57
57 -
 58
58 -
 59
59 -
 60
60 -
 61
61 -
 62
62 -
 63
63 -
 64
64 -
 65
65 -
 66
66 -
 67
67 -
 68
68 -
 69
69 -
 70
70 -
 71
71 -
 72
72 -
 73
73 -
 74
74 -
75
-
76
-
77
-
78
-
79
-
80
-
81
-
82
-
83
-
84
-
85
-
86
-
87
-
88
-
89
-
90
-
91
-
92
-
93
-
94
-
95
-
96
-
97
-
98
-
99
-
100
 |
 |

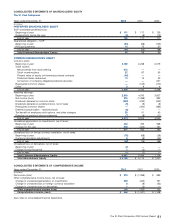
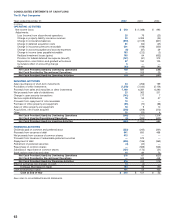
CONSOLIDATED STATEMENTS OF CASH FLOWS
The St. Paul Companies
Years ended December 31 2002 2001 2000
(In millions)
OPERATING ACTIVITIES
Net income (loss) $218 $(1,088) $ 993
Adjustments:
Loss (income) from discontinued operations 25 79 (23)
Change in property-liability insurance reserves 33 4,399 (34)
Change in reinsurance balances (970) (2,109) (807)
Change in deferred acquisition costs 81 (53) (45)
Change in insurance premiums receivable 501 (198) (450)
Change in accounts payable and accrued expenses (6) (87) 29
Change in income taxes payable/refundable 183 (212) (3)
Realized investment losses (gains) 165 94 (632)
Provision for federal deferred tax expense (benefit) (141) (81) 372
Depreciation, amortization and goodwill write-downs 97 180 105
Cumulative effect of accounting change 6——
Other (63) (40) (93)
Net Cash Provided (Used) by Continuing Operations 129 884 (588)
Net Cash Provided by Discontinued Operations —103 25
Net Cash Provided (Used) by Operating Activities 129 987 (563)
INVESTING ACTIVITIES
Sales (purchases) of short-term investments 43 (256) 199
Purchases of other investments (7,578) (7,033) (5,154)
Proceeds from sales and maturities of other investments 7,199 6,281 6,290
Net proceeds from sale of subsidiaries 23 362 201
Change in open security transactions (141) 177 7
Venture capital distributions 78 52 57
Proceeds from repayment of note receivable 70 ——
Purchase of office property and equipment (65) (70) (88)
Sales of office property and equipment 18 910
Acquisitions, net of cash acquired (216) (208) (212)
Other 20 (25) 4
Net Cash Provided (Used) by Continuing Operations (549) (711) 1,314
Net Cash Used by Discontinued Operations (5) (583) (632)
Net Cash Provided (Used) by Investing Activities (554) (1,294) 682
FINANCING ACTIVITIES
Dividends paid on common and preferred stock (253) (245) (241)
Proceeds from issuance of debt 941 650 498
Net proceeds from issuance of common shares 413 ——
Proceeds from issuance of redeemable preferred securities —575 —
Repayment of debt (405) (196) (363)
Retirement of preferred securities (4) (40) —
Repurchase of common shares —(589) (536)
Subsidiary’s repurchase of common shares (151) (172) (51)
Stock options exercised and other 35 84 73
Net Cash Provided (Used) by Continuing Operations 576 67 (620)
Net Cash Provided by Discontinued Operations —343 448
Net Cash Provided (Used) by Financing Activities 576 410 (172)
Effect of exchange rate changes on cash 13 (4) —
Increase (Decrease) in Cash 164 99 (53)
Cash at beginning of year 151 52 105
Cash at End of Year $315 $151 $ 52
See notes to consolidated financial statements.
62