Travelers 2002 Annual Report Download - page 41
Download and view the complete annual report
Please find page 41 of the 2002 Travelers annual report below. You can navigate through the pages in the report by either clicking on the pages listed below, or by using the keyword search tool below to find specific information within the annual report.-
 1
1 -
2
-
3
-
4
-
5
-
6
-
7
-
8
-
9
-
10
-
11
-
12
-
13
-
14
-
15
-
16
-
17
-
18
-
19
-
20
-
21
-
22
-
23
-
24
-
25
-
26
-
27
-
28
-
29
-
30
-
 31
31 -
 32
32 -
 33
33 -
 34
34 -
 35
35 -
 36
36 -
 37
37 -
 38
38 -
 39
39 -
 40
40 -
 41
41 -
 42
42 -
 43
43 -
 44
44 -
 45
45 -
 46
46 -
 47
47 -
 48
48 -
 49
49 -
 50
50 -
 51
51 -
52
-
53
-
54
-
55
-
56
-
57
-
58
-
59
-
60
-
61
-
62
-
63
-
64
-
65
-
66
-
67
-
68
-
69
-
70
-
71
-
72
-
73
-
74
-
75
-
76
-
77
-
78
-
79
-
80
-
81
-
82
-
83
-
84
-
85
-
86
-
87
-
88
-
89
-
90
-
91
-
92
-
93
-
94
-
95
-
96
-
97
-
98
-
99
-
100
 |
 |

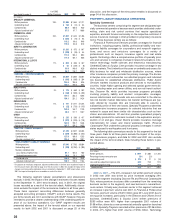
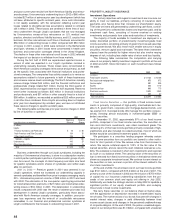
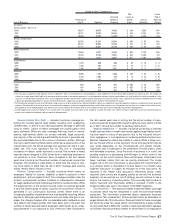
2002
Beginning Reserve
Accident Year Reserve Charge
(In millions)
2001 $ 77 $25
2000 27 23
1999 4 7
Prior 44 8
Total $ 152 $63
Certain segments of our commercial surety business tend to be
characterized by low frequency but potentially high severity losses. In
October of 2000, we made a strategic decision to significantly reduce
the exposures in these segments. Since that time, we have reduced
our total commercial surety gross open bond exposure by over 40% as
of December 31, 2002.
Within these segments, we have exposures related to a small num-
ber of accounts, which are in various stages of bankruptcy proceed-
ings. In addition, certain other accounts have experienced
deterioration in creditworthiness since we issued bonds to them.Given
the current economic climate and its impact on these companies, we
may experience an increase in claims and, possibly, incur high sever-
ity losses. Such losses would be recognized in the period in which the
claims are filed and determined to be a valid loss under the provisions
of the surety bond issued.
With regard to commercial surety bonds issued on behalf of compa-
nies operating in the energy trading sector (excluding Enron
Corporation), our aggregate pretax exposure, net of facultative reinsur-
ance, is with six companies for a total of approximately $425 million
($356 million of which is from gas supply bonds), an amount which will
decline over the contract periods. The largest individual exposure
approximates $192 million (pretax).These companies all continue to per-
form their bonded obligations and, therefore, no claims have been filed.
With regard to commercial surety bonds issued on behalf of compa-
nies currently in bankruptcy, our largest individual exposure, pretax and
before estimated reinsurance recoveries, approximated $120 million as
of December 31, 2002. Although no claims have been filed for this
account, it is reasonably possible that a claim will be filed for up to
$40 million, the full amount of one bond related to this exposure. Based
on the availability of reinsurance and other factors, we do not believe
that such a claim would materially impact our after-tax results of opera-
tions. Our remaining exposure to this account consists of approximately
$80 million in bonds securing certain workers’ compensation obliga-
tions. To date, no claims have been asserted against these workers’
compensation bonds and we currently have insufficient information to
estimate the amount of any claims that might be asserted in the future.
To the extent that claims are made under these workers’ compensation
bonds, we believe that they would likely be asserted for amounts lower
than the face amounts, and settled on a present value basis.
In addition to the exposures discussed above with respect to energy
trading companies and companies in bankruptcy, our commercial
surety business as of December 31, 2002 included eight accounts with
gross pretax bond exposures greater than $100 million each, before
reinsurance.The majority of these accounts have investment grade rat-
ings, and all accounts continue to perform their bonded obligations.
We continue with our intention to exit the segments of the commer-
cial surety market discussed above by ceasing to write new business
and, where possible, terminating the outstanding bonds. We will con-
tinue to be a market for traditional commercial surety business, which
includes low-limit business such as license and permit, probate, public
official, and customs bonds.
2001 vs.2000 — The 10% increase in premium volume in 2001 was
primarily due to price increases in the Construction business center,
which averaged 18% for the year. Construction premiums totaled $609
million in 2001, compared with $472 million in 2000. Surety premiums
of $397 million declined 10% compared with 2000, reflecting the impact
of tightened underwriting standards we began to implement near the
end of 1999 in anticipation of an economic slowdown in both the United
States and Mexico. As that slowdown materialized in 2001, our tight-
ened standards had produced a more conservative risk profile of our
commercial surety exposures, as described above. An increase in rein-
surance costs was also a factor in the decline in Surety’s net written pre-
miums in 2001. The Surety & Construction business centers both
contributed to the deterioration in 2001 underwriting results compared
with 2000.The Surety underwriting profit of $5 million declined from the
comparable 2000 profit of $30 million, reflecting an increase in loss
experience amid the economic downturn in the United States. Also
included in the 2001 Surety result was a $10 million provision for losses
associated with Enron Corporation’s bankruptcy filing late in the year.
The Construction underwriting loss of $57 million in 2001 deterio-
rated from 2000’s comparable loss of $11 million, driven by adverse
development on prior-year business that prompted a $24 million provi-
sion to strengthen loss reserves. Current accident year loss experi-
ence in 2001 improved over 2000, reflecting the impact of aggressive
pricing and underwriting initiatives. Construction’s 2000 underwriting
result included the benefit of prior-year reserve reductions totaling
$57 million, including $33 million of workers’ compensation loss
reserves. The strong improvement in the segment-wide expense ratio
over 2000 reflected the combined effect of Construction’s written pre-
mium growth and active management of expenses in both operations.
PROPERTY-LIABILITY INSURANCE OPERATIONS
International & Lloyd’s
Following the realignment of our business segments in the fourth
quarter of 2002, our International & Lloyd’s segment consists of the fol-
lowing components: our ongoing operations at Lloyd’s, and our ongo-
ing specialty commercial operations outside of the United States,
including our Global Accounts business center (collectively referred to
hereafter as “international specialties”).Through a single wholly-owned
syndicate at Lloyd’s established in 2002, we underwrite insurance in
four principal lines of business: Aviation, Marine, Global Property and
Personal Lines. Aviation underwrites a broad spectrum of international
airline, manufacturer, airport and general aviation business. Marine
underwrites energy, cargo and hull coverages. Global Property under-
writes property coverages worldwide. Personal Lines provides special-
ized accident and health coverages for international clients, including
personal accident, kidnap and ransom, and payment protection insur-
ance. Prior to the formation of this single syndicate (Syndicate 5000),
this business was underwritten through three other syndicates that we
managed. Our ongoing international specialties are located in the
United Kingdom, Canada and the Republic of Ireland, where we offer
specialized insurance and risk management services to a variety of
industry sectors.
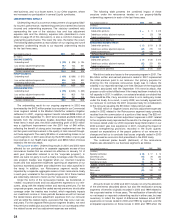
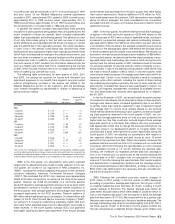
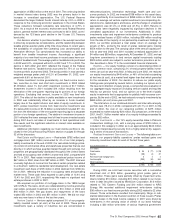
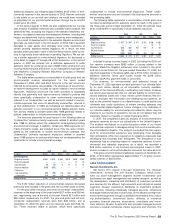
The following table summarizes results for this segment for the last
three years. Data for 2002 and 2001 exclude the impact of the terror-
ist attack, and data for all three years exclude the impact of the corpo-
rate reinsurance program.Data including these factors is presented on
page 36 of this discussion.
Years Ended December 31 2002 2001 2000
($ in millions)
Written premiums $815 $628 $ 475
Percentage increase over prior year 30% 32%
Underwriting result $26 $(108) $ (105)
Loss and loss adjustment expense ratio 72.1 93.6 97.5
Underwriting expense ratio 23.6 25.1 25.2
Combined ratio 95.7 118.7 122.7
2002 vs. 2001 — All lines of business in this segment contributed
to the significant growth in net written premiums over 2001. At Lloyd’s,
2002 premium volume of $324 million grew 31% over comparable
2001 premiums of $247 million, primarily driven by strong price
increases and new business in certain classes of our Personal Lines
business. In addition, Aviation premiums increased significantly due to
our increased participation in that coverage in 2002. In our interna-
tional specialty operations, premium volume of $491 million was 29%
higher than the 2001 total of $381 million, driven by price increases
The St. Paul Companies 2002 Annual Report 39