Travelers 2002 Annual Report Download - page 33
Download and view the complete annual report
Please find page 33 of the 2002 Travelers annual report below. You can navigate through the pages in the report by either clicking on the pages listed below, or by using the keyword search tool below to find specific information within the annual report.-
 1
1 -
2
-
3
-
4
-
5
-
6
-
7
-
8
-
9
-
10
-
11
-
12
-
13
-
14
-
15
-
16
-
17
-
18
-
19
-
20
-
21
-
22
-
 23
23 -
 24
24 -
 25
25 -
 26
26 -
 27
27 -
 28
28 -
 29
29 -
 30
30 -
 31
31 -
 32
32 -
 33
33 -
 34
34 -
 35
35 -
 36
36 -
 37
37 -
 38
38 -
 39
39 -
 40
40 -
 41
41 -
 42
42 -
 43
43 -
44
-
45
-
46
-
47
-
48
-
49
-
50
-
51
-
52
-
53
-
54
-
55
-
56
-
57
-
58
-
59
-
60
-
61
-
62
-
63
-
64
-
65
-
66
-
67
-
68
-
69
-
70
-
71
-
72
-
73
-
74
-
75
-
76
-
77
-
78
-
79
-
80
-
81
-
82
-
83
-
84
-
85
-
86
-
87
-
88
-
89
-
90
-
91
-
92
-
93
-
94
-
95
-
96
-
97
-
98
-
99
-
100
 |
 |

Reinsurance — Our reported written premiums, earned premiums
and losses and LAE reflect the net effects of assumed and ceded
reinsurance. Premiums are recorded at the inception of each policy,
based on information received from ceding companies and their bro-
kers. For excess-of-loss contracts, the amount of premium is usually
contractually documented at inception, and no management judg-
ment is necessary in accounting for this. Premiums are earned on a
pro rata basis over the coverage period. For proportional treaties, the
amount of premium is normally estimated at inception by the ceding
company. We account for such premium using the initial estimates,
and adjust them once a sufficient period for actual premium reporting
has elapsed. Reinstatement and additional premiums are written at
the time a loss event occurs where coverage limits for the remaining
life of the contract are reinstated under pre-defined contract terms.
Reinstatement premiums are the premiums charged for the restora-
tion of the reinsurance limit of a catastrophe contract to its full amount
after payment by the reinsurer of losses as a result of an occurrence.
These premiums relate to the future coverage obtained during the
remainder of the initial policy term, and are earned over the remain-
ing policy term. Additional premiums are premiums charged after cov-
erage has expired that are related to experience during the policy
term, which are earned immediately.
Reinsurance accounting is followed for assumed and ceded trans-
actions when risk transfer requirements have been met. These
requirements involve significant assumptions being made relating to
the amount and timing of expected cash flows, as well as the interpre-
tation of underlying contract terms. Reinsurance contracts that do not
transfer significant insurance risk are considered financing transac-
tions and are required to be accounted for as deposits.
We estimate and record an allowance for reinsurance amounts
that may not be collectible, due to credit issues, disputes over cover-
age, or other considerations.
Investments — We continually monitor the difference between our
cost and the estimated fair value of investments, which involves
uncertainty as to whether declines in value are temporary in nature. If
we believe a decline in the value of a particular investment is tempo-
rary, we record the decline as an unrealized loss in our common
shareholders’ equity. If we believe the decline is “other than tempo-
rary,” we write down the carrying value of the investment and record a
realized loss on our statement of operations. Our assessment of a
decline in value includes our current judgment as to the financial posi-
tion and future prospects of the entity that issued the investment secu-
rity. If that judgment changes in the future, we may ultimately record a
realized loss after having originally concluded that the decline in value
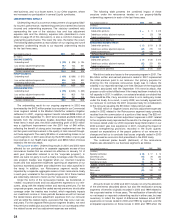
was temporary.The following table summarizes the total pretax gross
unrealized loss recorded in our common shareholders’ equity at
December 31, 2002 and 2001, by invested asset class.
December 31 2002 2001
(In millions)
Fixed income (including securities on loan): $52 $78
Equities 37 112
Venture capital 119 117
Total unrealized loss $208 $307
At December 31, 2002 and 2001, the carrying value of our consol-
idated invested asset portfolio included $1.03 billion and $688 million
of net pretax unrealized appreciation, respectively. Included in those
net amounts were gross pretax unrealized losses of $208 million and
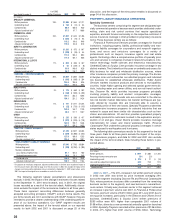
$307 million, respectively. The following table summarizes, for all
securities in an unrealized loss position at December 31, 2002 and
2001, the aggregate fair value and gross unrealized loss by length of
time those securities have been continuously in an unrealized loss
position. The cost of these investments represented approximately
8% of our investment portfolio (at cost) at December 31, 2002. The
majority of unrealized losses for fixed income securities are issuer-
specific rather than interest rate-related.
December 31 2002 2001
Gross Gross
Fair Unrealized Fair Unrealized
Value Loss Value Loss
(In millions)
Fixed income (including securities on loan):
0 – 6 months $673 $ 27 $2,405 $ 47
7 – 12 months 198 9 86 8
Greater than 12 months 198 16 256 23
Total 1,069 52 2,747 78
Equities:
0 – 6 months 144 15 593 92
7 – 12 months 80 20 57 13
Greater than 12 months 4220 7
Total 228 37 670 112
Venture capital:
0 – 6 months 60 49 104 52
7 – 12 months 39 25 39 34
Greater than 12 months 44 45 36 31
Total 143 119 179 117
Total $1,440 $208 $3,596 $ 307
At December 31, 2002, our fixed income investment portfolio
included non-investment grade securities and nonrated securities that
in total comprised approximately 3% of the portfolio. Included in those
categories at that date were securities in an unrealized loss position
that, in the aggregate, had an amortized cost of $160 million and a fair
value of $140 million, resulting in a net pretax unrealized loss of
$20 million. These securities represented 1% of the total amortized
cost and fair value of the fixed income portfolio at December 31, 2002,
and accounted for 38% of the total pretax unrealized loss in the fixed
income portfolio. Included in those categories at December 31, 2001
were securities in an unrealized loss position that, in the aggregate,
had an amortized cost of $212 million and a fair value of $193 million,
resulting in a net pretax unrealized loss of $19 million. These securi-
ties represented 1% of the total amortized cost and fair value of the
fixed income portfolio at December 31, 2001, and accounted for 24%
of the total pretax unrealized loss in the fixed maturity portfolio.
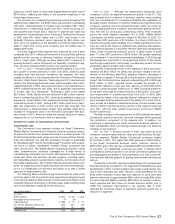
The following table presents information regarding those fixed
income investments, by remaining period to maturity date, that were
in an unrealized loss position at December 31, 2002.
Amortized Estimated
December 31, 2002 Cost Fair Value
(In millions)
Remaining period to maturity date:
One year or less $ 180 $ 178
Over one year through five years 123 120
Over five years through ten years 316 299
Over ten years 340 328
Asset/mortgage-backed securities with various maturities 162 144
Total $ 1,121 $ 1,069
Our investment portfolio also includes non-publicly traded securi-
ties, the vast majority of which are held in our venture capital and real
estate portfolios.Our venture capital investments represent ownership
interests in small- to medium-sized companies, which are carried at
estimated fair value.Fair values are based on an estimate determined
by an internal valuation committee for securities for which there is no
public market. The internal valuation committee reviews such factors
as recent financings, operating results, balance sheet stability, growth,
and other business and market sector fundamental statistics in esti-
mating fair values of specific investments.For our real estate joint ven-
tures, we use the equity method of accounting, meaning that we carry
these investments at cost, adjusted for our share of earnings or
losses, and reduced by cash distributions from the partnerships and
valuation adjustments. Due to time constraints in obtaining financial
results from the partnerships, the results of these operations are
recorded on a one-month lag. If events occur during the lag period,
The St. Paul Companies 2002 Annual Report 31