Travelers 2002 Annual Report Download - page 48
Download and view the complete annual report
Please find page 48 of the 2002 Travelers annual report below. You can navigate through the pages in the report by either clicking on the pages listed below, or by using the keyword search tool below to find specific information within the annual report.-
 1
1 -
2
-
3
-
4
-
5
-
6
-
7
-
8
-
9
-
10
-
11
-
12
-
13
-
14
-
15
-
16
-
17
-
18
-
19
-
20
-
21
-
22
-
23
-
24
-
25
-
26
-
27
-
28
-
29
-
30
-
31
-
32
-
33
-
34
-
35
-
36
-
37
-
 38
38 -
 39
39 -
 40
40 -
 41
41 -
 42
42 -
 43
43 -
 44
44 -
 45
45 -
 46
46 -
 47
47 -
 48
48 -
 49
49 -
 50
50 -
 51
51 -
 52
52 -
 53
53 -
 54
54 -
 55
55 -
 56
56 -
 57
57 -
 58
58 -
59
-
60
-
61
-
62
-
63
-
64
-
65
-
66
-
67
-
68
-
69
-
70
-
71
-
72
-
73
-
74
-
75
-
76
-
77
-
78
-
79
-
80
-
81
-
82
-
83
-
84
-
85
-
86
-
87
-
88
-
89
-
90
-
91
-
92
-
93
-
94
-
95
-
96
-
97
-
98
-
99
-
100
 |
 |

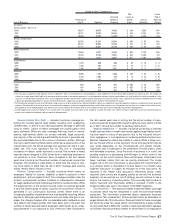
and corporate bonds following economic upheaval in that country, and
a $19 million write-down in debt securities issued by Enron
Corporation following that company’s bankruptcy filing. We recorded
additional impairment write-downs totaling $38 million in our fixed
income portfolio during 2001 related to 19 other issuers. Each of these
write-downs was carried out by writing our stated book value down to
our estimate of net realizable value.
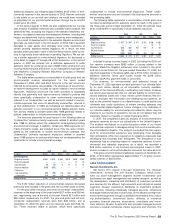
Realized losses from our equity portfolio in 2002 primarily con-
sisted of those resulting from sales following the strategic decision to
re-allocate funds to the fixed maturity portfolio, and impairment write-
downs totaling $26 million.
In our venture capital portfolio, realized losses in 2002 included $56
million of losses resulting from the sale of the vast majority of our part-
nership investment holdings, and impairment write-downs totaling
$122 million. Realized losses in 2001 largely resulted from the sale of
several of our direct investments. In addition, we recorded write-downs,
which in the aggregate totaled $88 million, related to 31 of our direct
venture capital investments in 2001. Venture capital realized gains in
2000 were primarily driven by sales of and distributions from invest-
ments in technology-related companies.
For publicly-traded securities in our venture capital portfolio, the
amounts of write-downs were determined by writing our investments
down to quoted market prices. For non-publicly-traded securities, the
write-downs were reviewed and approved by our internal valuation
committee, which, on a quarterly basis, evaluates recent financings,
operating results, balance sheet stability, growth, and other business
and sector fundamentals in determining fair values of the specific
investments. On an ongoing basis, our venture capital portfolio man-
agers monitor the activities of both our publicly-traded and non-pub-
licly-traded securities, keeping in mind developments that might give
rise to necessary valuation adjustments. These managers may report
any such developments to the internal valuation committee.
A significant amount of additional information regarding procedures
employed to evaluate other than temporary impairments in the carry-
ing value of any of our investments is contained in the Critical
Accounting Policies section on pages 30 through 32 of this discussion.
PROPERTY-LIABILITY UNDERWRITING
Loss and Loss Adjustment Expense Reserves
Our loss reserves reflect estimates of total losses and loss adjust-
ment expenses we will ultimately have to pay under insurance policies,
surety bonds and reinsurance agreements. These include losses that
have been reported but not settled, and losses that have been incurred
but not yet reported to us (“IBNR”). Loss reserves for certain workers’
compensation business and certain assumed reinsurance contracts
are discounted to present value. We reduce our loss reserves for esti-
mates of salvage and subrogation.
For reported losses, we establish reserves on a “case” basis within
the parameters of coverage provided in the insurance policy, surety
bond or reinsurance agreement. For IBNR losses, we estimate
reserves using established actuarial methods. Our case and IBNR
reserve estimates consider such variables as past loss experience,
changes in legislative conditions, changes in judicial interpretation of
legal liability and policy coverages, and inflation. We consider not only
monetary increases in the cost of what we insure, but also changes in
societal factors that influence jury verdicts and case law and, in turn,
claim costs.
46
Because many of the coverages we offer involve claims that may
not ultimately be settled for many years after they are incurred, subjec-
tive judgments as to our ultimate exposure to losses are an integral
and necessary component of our loss reserving process. We record
our reserves by considering a range of estimates bounded by a high
and low point.Within that range, we record our best estimate. We con-
tinually review our reserves, using a variety of statistical and actuarial
techniques to analyze current claim costs, frequency and severity data,
and prevailing economic, social and legal factors. We adjust reserves
established in prior years as loss experience develops and new infor-
mation becomes available. Adjustments to previously estimated
reserves are reflected in our financial results in the periods in which
they are made.
While our reported reserves make a reasonable provision for all of
our unpaid loss and loss adjustment expense obligations, it is impor-
tant to note that the process of estimating required reserves does, by
its very nature, involve uncertainty.The level of uncertainty can be influ-
enced by such things as the existence of long tail coverage forms and
changes in claim handling practices. Many of our insurance sub-
sidiaries have written long-tail coverages such as medical professional
liability, large deductible workers’ compensation and assumed reinsur-
ance. In addition, claim handling practices change and evolve over the
years. For example, new initiatives are commenced, claim offices are
reorganized and relocated, claim handling responsibilities of individual
adjusters are changed, use of a call center is increased, use of
technology is increased, caseload issues and case reserving practices
are monitored more frequently, etc. However, these are sources of
uncertainty that we have recognized and for which we have appropri-
ately reserved.
Analysis of Our Long-Tail Exposures We consider “long-tail”
exposures to include those lines of business in which the majority of
coverage involves average loss payment lags of three years or more
beyond the expiration of the policy and, accordingly, can cause an
increased level of uncertainty in estimating loss reserves.The primary
lines of our business fitting those criteria are general liability, workers’
compensation, and casualty excess reinsurance.In addition, we insure
medical malpractice that does not exceed a three-year average life, but
does involve a high degree of uncertainty. We analyze these reserves
in accordance with our accounting policy as further described on
page 30 of this discussion.
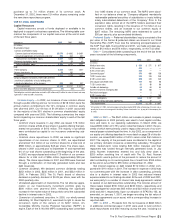
The following table provides additional statistics on our long tail
and medical malpractice exposures and is followed by discussion on
known trends, events, or uncertainties that may affect our future
results of operations or financial condition. We also further describe
the nature of the underlying claims, including relevant information of
the claimant population. For our general liability and workers’compen-
sation lines of business, we have reported separately our exposures
to possible environmental and asbestos (“E&A”) obligations. For our
non-E&A general liability, workers’ compensation, and medical mal-
practice coverages, we have included data only for our primary
domestic insurance operations, excluding alternative risk transfer
insurance products. The coverages in the table represented approxi-
mately 68% of our total net loss and loss adjustment expense
reserves at December 31, 2002.