Travelers 2002 Annual Report Download - page 74
Download and view the complete annual report
Please find page 74 of the 2002 Travelers annual report below. You can navigate through the pages in the report by either clicking on the pages listed below, or by using the keyword search tool below to find specific information within the annual report.-
 1
1 -
2
-
3
-
4
-
5
-
6
-
7
-
8
-
9
-
10
-
11
-
12
-
13
-
14
-
15
-
16
-
17
-
18
-
19
-
20
-
21
-
22
-
23
-
24
-
25
-
26
-
27
-
28
-
29
-
30
-
31
-
32
-
33
-
34
-
35
-
36
-
37
-
38
-
39
-
40
-
41
-
42
-
43
-
44
-
45
-
46
-
47
-
48
-
49
-
50
-
51
-
52
-
53
-
54
-
55
-
56
-
57
-
58
-
59
-
60
-
61
-
62
-
63
-
 64
64 -
 65
65 -
 66
66 -
 67
67 -
 68
68 -
 69
69 -
 70
70 -
 71
71 -
 72
72 -
 73
73 -
 74
74 -
 75
75 -
 76
76 -
 77
77 -
 78
78 -
 79
79 -
 80
80 -
 81
81 -
 82
82 -
 83
83 -
 84
84 -
85
-
86
-
87
-
88
-
89
-
90
-
91
-
92
-
93
-
94
-
95
-
96
-
97
-
98
-
99
-
100
 |
 |

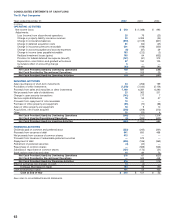
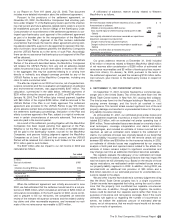
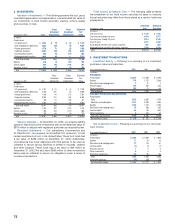
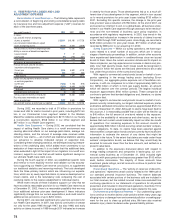
8. INVESTMENTS
Valuation of Investments — The following presents the cost, gross
unrealized appreciation and depreciation, and estimated fair value of
our investments in fixed income securities, equities, venture capital
and securities on loan.
Gross Gross Estimated
Unrealized Unrealized Fair
December 31, 2002 Cost Appreciation Depreciation Value
(In millions)
Fixed income:
U.S. government $1,054 $ 73 $ (2) $ 1,125
State and political subdivisions 4,263 350 (4) 4,609
Foreign governments 1,779 71 (2) 1,848
Corporate securities 6,482 433 (22) 6,893
Asset-backed securities 660 40 (17) 683
Mortgage-backed securities 1,940 90 — 2,030
Total fixed income 16,178 1,057 (47) 17,188
Equities 416 15 (37) 394
Venture capital 577 123 (119) 581
Securities on loan 764 47 (5) 806
Total $17,935 $ 1,242 $ (208) $ 18,969
Gross Gross Estimated
Unrealized Unrealized Fair
December 31, 2001 Cost Appreciation Depreciation Value
(In millions)
Fixed income:
U.S. government $ 1,197 $ 74 $ (1) $ 1,270
State and political subdivisions 4,720 231 (3) 4,948
Foreign governments 1,168 44 (11) 1,201
Corporate securities 5,324 212 (43) 5,493
Asset-backed securities 445 12 (10) 447
Mortgage-backed securities 2,493 65 (6) 2,552
Total fixed income 15,347 638 (74) 15,911
Equities 1,415 107 (112) 1,410
Venture capital 766 210 (117) 859
Securities on loan 739 40 (4) 775
Total $ 18,267 $ 995 $ (307) $ 18,955
Statutory Deposits — At December 31, 2002, our property-liability
operation had fixed income investments with an estimated fair value of
$973 million on deposit with regulatory authorities as required by law.
Restricted Investments — Our subsidiaries Unionamerica and
St. Paul Re-U.K., are required, as accredited U.S. reinsurers, to hold
certain investments in trust in the United States.These trust funds had
a fair value of $496 million at December 31, 2002. Additionally,
Unionamerica has funds deposited with third parties to be used as
collateral to secure various liabilities on behalf of insureds, cedants
and other creditors. These funds had a fair value of $44 million at
December 31, 2002. We also have $386 million of other investments
being used as collateral to secure our obligations under a series of
insurance transactions.
72
Fixed Income by Maturity Date — The following table presents
the breakdown of our fixed income securities by years to maturity.
Actual maturities may differ from those stated as a result of calls and
prepayments.
Amortized Estimated
December 31, 2002 Cost Fair Value
(In millions)
One year or less $1,130 $ 1,155
Over one year through five years 4,463 4,777
Over five years through 10 years 3,814 4,105
Over 10 years 4,171 4,438
Asset-backed securities with various maturities 660 683
Mortgage-backed securities with various maturities 1,940 2,030
Total $16,178 $ 17,188
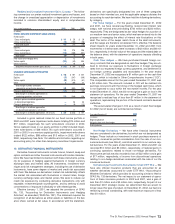
9. INVESTMENT TRANSACTIONS
Investment Activity — Following is a summary of our investment
purchases, sales and maturities.
Years ended December 31 2002 2001 2000
(In millions)
PURCHASES
Fixed income $6,019 $4,959 $ 2,489
Equities 776 1,737 2,168
Real estate and mortgage loans 327 3
Venture capital 192 287 446
Other investments 588 23 48
Total purchases 7,578 7,033 5,154
PROCEEDS FROM SALES AND MATURITIES
Fixed income:
Sales 3,215 2,035 1,739
Maturities and redemptions 2,131 2,200 1,406
Equities 1,705 1,732 2,183
Real estate and mortgage loans 76 100 265
Venture capital 64 50 663
Other investments 8164 34
Total sales and maturities 7,199 6,281 6,290
Net purchases (sales) $379 $752 $ (1,136)
Net Investment Income – Following is a summary of our net invest-
ment income.
Years ended December 31 2002 2001 2000
(In millions)
Fixed income $1,068 $1,069 $ 1,090
Equities 11 16 16
Real estate and mortgage loans 77 115 91
Venture capital (2) (4) (1)
Securities on loan 122
Other investments 534
Short-term investments 33 55 83
Total 1,193 1,256 1,285
Investment expenses (24) (39) (23)
Net investment income $1,169 $1,217 $ 1,262