Travelers 2002 Annual Report Download - page 78
Download and view the complete annual report
Please find page 78 of the 2002 Travelers annual report below. You can navigate through the pages in the report by either clicking on the pages listed below, or by using the keyword search tool below to find specific information within the annual report.-
 1
1 -
2
-
3
-
4
-
5
-
6
-
7
-
8
-
9
-
10
-
11
-
12
-
13
-
14
-
15
-
16
-
17
-
18
-
19
-
20
-
21
-
22
-
23
-
24
-
25
-
26
-
27
-
28
-
29
-
30
-
31
-
32
-
33
-
34
-
35
-
36
-
37
-
38
-
39
-
40
-
41
-
42
-
43
-
44
-
45
-
46
-
47
-
48
-
49
-
50
-
51
-
52
-
53
-
54
-
55
-
56
-
57
-
58
-
59
-
60
-
61
-
62
-
63
-
64
-
65
-
66
-
67
-
 68
68 -
 69
69 -
 70
70 -
 71
71 -
 72
72 -
 73
73 -
 74
74 -
 75
75 -
 76
76 -
 77
77 -
 78
78 -
 79
79 -
 80
80 -
 81
81 -
 82
82 -
 83
83 -
 84
84 -
 85
85 -
 86
86 -
 87
87 -
 88
88 -
89
-
90
-
91
-
92
-
93
-
94
-
95
-
96
-
97
-
98
-
99
-
100
 |
 |

If we believe that any of our deferred tax assets will not result in
future tax benefits, we must establish a valuation allowance for the
portion of these assets that we think will not be realized. The net
change in the valuation allowance for deferred tax assets was an
increase of $27 million in 2002, and an increase of $74 million in
2001, both relating to our foreign operations. Based predominantly
upon a review of our anticipated future earnings, but also including all
other available evidence, both positive and negative, we have con-
cluded it is “more likely than not” that our net deferred tax assets will
be realized.
Net Operating Loss (“NOL”) and Foreign Tax Credit (“FTC”)
Carryforwards — For tax return purposes, as of December 31, 2002,
we had NOL carryforwards that expire, if unused, in 2005-2022 and
FTC carryforwards that expire, if unused, in 2005-2007. The amount
and timing of realizing the benefits of NOL and FTC carryforwards
depend on future taxable income and limitations imposed by tax laws.
The approximate amounts of those NOLs on a regular tax basis and
an alternative minimum tax (“AMT”) basis were $2.6 billion and $1 bil-
lion, respectively. The approximate amounts of the FTCs both on a
regular tax basis and an AMT basis were $12 million. The benefits of
the NOL and FTC carryforwards have been recognized in our consol-
idated financial statements.
Undistributed Earnings of Subsidiaries — U.S. income taxes have
not been provided on $67 million of our foreign operations’ undistrib-
uted earnings as of December 31, 2002, as such earnings are
intended to be permanently reinvested in those operations.
Furthermore, any taxes paid to foreign governments on these earn-
ings may be used as credits against the U.S. tax on any dividend dis-
tributions from such earnings.
We have not provided taxes on approximately $402 million of
undistributed earnings related to our majority ownership of Nuveen
Investments as of December 31, 2002, because we currently do not
expect those earnings to become taxable to us.
IRS Examinations — During 1998 we merged with USF&G
Corporation (“USF&G”).The IRS is currently examining USF&G’s pre-
merger consolidated returns for the years 1994 through 1997. The
IRS has examined The St. Paul’s pre-merger consolidated returns
through 1997 and is currently examining the years 1998 through
2000. We believe that any additional taxes assessed as a result of
these examinations would not materially affect our overall financial
position, results of operations or liquidity.
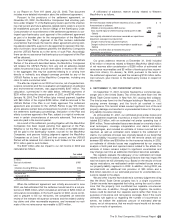
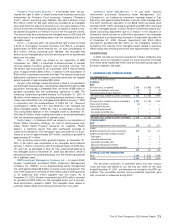
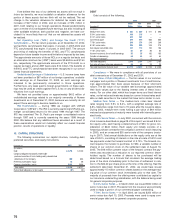
13. CAPITAL STRUCTURE
The following summarizes our capital structure, including debt,
preferred securities, and equity instruments.
December 31 2002 2001
($ in millions)
Debt $2,713 $2,130
Company-obligated mandatorily redeemable
preferred securities of trusts holding solely subordinated
debentures of the Company 889 893
Preferred shareholders’ equity 65 58
Common shareholders’ equity 5,681 5,056
Total capital $9,348 $8,137
Ratio of debt obligations to total capital 29% 26%
76
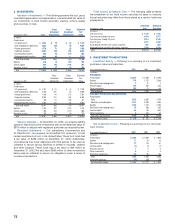
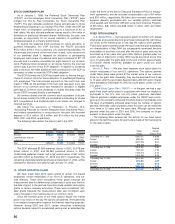
DEBT
Debt consists of the following.
2002 2001
Book Fair Book Fair
December 31 Value Value Value Value
(In millions)
Medium-term notes $523 $ 559 $571 $ 596
5-3/4% senior notes 499 515 ——
5-1/4% senior notes 443 461 ——
Commercial paper 379 379 606 606
7-7/8% senior notes 249 274 249 269
8-1/8% senior notes 249 280 249 275
Zero coupon convertible notes 107 110 103 106
7-1/8% senior notes 80 87 80 84
Nuveen Investments line of credit borrowings 55 55 183 183
Variable rate borrowings 64 64 64 64
Real estate mortgages —— 22
Total debt obligations 2,648 2,784 2,107 2,185
Fair value of interest rate swap agreements 65 65 23 23
Total debt reported on balance sheet $2,713 $ 2,849 $2,130 $ 2,208
Compliance — We were in compliance with all provisions of our
debt covenants as of December 31, 2002 and 2001.
Fair Value of Debt Obligations — The fair values of our commer-
cial paper and a portion of Nuveen Investments’ line of credit borrow-
ings approximated their book values because of their short-term
nature. The fair value of our variable rate borrowings approximated
their book values due to the floating interest rates of these instru-
ments. For our other debt, which has longer terms and fixed interest
rates, our fair value estimate was based on current interest rates avail-
able on debt securities in the market that have terms similar to ours.
Medium-Term Notes — The medium-term notes bear interest
rates ranging from 5.9% to 8.4%, with a weighted average rate of
6.8%. Maturities range from five to 15 years after the issuance dates.
During 2002, medium-term notes having a par value of $49 million
matured and payments at maturity were funded with internally gener-
ated funds.
5-1/4% Senior Notes — In July 2002, concurrent with the common
stock issuance described on page 28 of this report, we issued 8.9 mil-
lion equity units, each having a stated amount of $50, for gross con-
sideration of $443 million. Each equity unit initially consists of a
forward purchase contract for the company’s common stock (maturing
in 2005), and an unsecured $50 senior note of the company (matur-
ing in 2007). Total annual distributions on the equity units are at the
rate of 9.00%, consisting of interest on the note at a rate of 5.25% and
fee payments under the forward contract of 3.75%. The forward con-
tract requires the investor to purchase, for $50, a variable number of
shares of our common stock on the settlement date of August 16,
2005. The $46 million present value of the forward contract fee pay-
ments was recorded as a reduction to our reported common share-
holders’ equity. The number of shares to be purchased will be
determined based on a formula that considers the average trading
price of the stock immediately prior to the time of settlement in rela-
tion to the $24.20 per share price at the time of the offering. Had the
settlement date been December 31, 2002, we would have issued
approximately 15 million common shares based on the average trad-
ing price of our common stock immediately prior to that date. The
majority of proceeds from the offering were contributed as capital to
our insurance underwriting subsidiaries, with the balance being used
for general corporate purposes.
5-3/4% Senior Notes — In March 2002, we issued $500 million of
senior notes due in 2007. Proceeds from the issuance were primarily
used to repay a portion of our commercial paper outstanding.
7-7/8% Senior Notes — In April 2000, we issued $250 million of
senior notes due April 15, 2005. Proceeds were used to repay com-
mercial paper debt and for general corporate purposes.