Travelers 2002 Annual Report Download - page 77
Download and view the complete annual report
Please find page 77 of the 2002 Travelers annual report below. You can navigate through the pages in the report by either clicking on the pages listed below, or by using the keyword search tool below to find specific information within the annual report.-
 1
1 -
2
-
3
-
4
-
5
-
6
-
7
-
8
-
9
-
10
-
11
-
12
-
13
-
14
-
15
-
16
-
17
-
18
-
19
-
20
-
21
-
22
-
23
-
24
-
25
-
26
-
27
-
28
-
29
-
30
-
31
-
32
-
33
-
34
-
35
-
36
-
37
-
38
-
39
-
40
-
41
-
42
-
43
-
44
-
45
-
46
-
47
-
48
-
49
-
50
-
51
-
52
-
53
-
54
-
55
-
56
-
57
-
58
-
59
-
60
-
61
-
62
-
63
-
64
-
65
-
66
-
 67
67 -
 68
68 -
 69
69 -
 70
70 -
 71
71 -
 72
72 -
 73
73 -
 74
74 -
 75
75 -
 76
76 -
 77
77 -
 78
78 -
 79
79 -
 80
80 -
 81
81 -
 82
82 -
 83
83 -
 84
84 -
 85
85 -
 86
86 -
 87
87 -
88
-
89
-
90
-
91
-
92
-
93
-
94
-
95
-
96
-
97
-
98
-
99
-
100
 |
 |

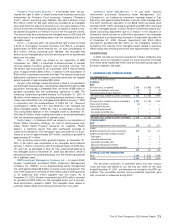
The following table summarizes the environmental and asbestos
reserves reflected in our consolidated balance sheet at December 31,
2002 and 2001. Amounts in the “net” column represent gross amounts
reduced by consolidated reinsurance recoverables. See Note 3 for a
discussion of a significant asbestos litigation settlement agreement.
December 31 2002 2001
(In millions) Gross Net Gross Net
Environmental $370 $ 298 $604 $ 519
Asbestos 1,245 778 577 387
Total environmental and asbestos reserves $1,615 $ 1,076 $1,181 $ 906
Late in 2001, we hired a new Executive Vice President of Claims,
with extensive experience with environmental and asbestos claims
handling and environmental and asbestos reserves, who conducted a
summary level review of our environmental and asbestos reserves.As
a result of observations made in this review, we undertook more
detailed actuarial and claims analyses of environmental reserves. No
adjustment to reserves was made in the fourth quarter of 2001, since
management did not have a sufficient basis for making an adjustment
until such supplemental analyses were completed, and we believed
our environmental and asbestos reserves were adequate as of
December 31, 2001.
Our historical methodology (through first quarter 2002) for review-
ing the adequacy of environmental and asbestos reserves utilized a
survival ratio method, which considers ending reserves in relation to
calendar year paid losses. When the environmental reserve analyses
were completed in the second quarter of 2002, we supplemented our
survival ratio analysis with the detailed additional analyses referred to
above, and concluded that our environmental reserves were redun-
dant by approximately $150 million. Based on our additional analyses,
we released approximately $150 million of environmental reserves in
the second quarter of 2002. Had we continued to rely solely on our
survival ratio analysis, we would have recorded no adjustment to our
environmental reserves through the six months ended June 30, 2002.
In the second quarter of 2002, we also supplemented our survival
ratio analysis of asbestos reserves with a detailed claims analysis.We
determined that, excluding the impact of the Western MacArthur set-
tlement, our asbestos reserves were adequate; however, including
that impact, we determined that our asbestos reserves were inade-
quate. As a result, gross and net asbestos reserves were increased
$150 million.
12. INCOME TAXES
Income Tax Expense (Benefit) — Income tax expenses or benefits
are recorded in various places in our consolidated financial state-
ments. A summary of the amounts and places follows.
Years ended December 31 2002 2001 2000
(In millions)
STATEMENTS OF OPERATIONS
Expense (benefit) on continuing operations $(73) $(422) $ 431
Expense on cumulative effect of accounting change 6——
Expense on operating loss of discontinued operations ——10
Expense (benefit) on gain or loss on disposal
of discontinued operations (17) 37 (6)
Total income tax expense (benefit) included
in consolidated statements of operations (84) (385) 435
COMMON SHAREHOLDERS’ EQUITY
Expense (benefit) relating to stock-based compensation
and the change in unrealized appreciation on
investments and unrealized foreign exchange 117 (218) 86
Total income tax expense (benefit) included
in consolidated financial statements $33 $(603) $ 521
Components of Income Tax Expense (Benefit) — The components
of income tax expense (benefit) on continuing operations are
as follows.
Years ended December 31 2002 2001 2000
(In millions)
Federal current tax expense (benefit) $7 $(303) $ 19
Federal deferred tax expense (benefit) (141) (81) 372
Total federal income tax expense (benefit) (134) (384) 391
Foreign income tax expense (benefit) 55 (48) 26
State income tax expense 610 14
Total income tax expense (benefit) on
continuing operations $(73) $(422) $ 431
Our Tax Rate is Different from the Statutory Rate — Our total
income tax expense (benefit) on income (loss) from continuing oper-
ations differs from the statutory rate of 35% of income from continu-
ing operations before income taxes as shown in the following table.
Years ended December 31 2002 2001 2000
($ in millions)
Federal income tax expense (benefit) at statutory rate $62 $(501) $ 490
Increase (decrease) attributable to:
Nontaxable investment income (76) (85) (95)
Valuation allowance 27 74 —
Foreign operations (89) 44 18
Goodwill —30 4
Employee stock ownership plan (4) (4) (4)
State income taxes, net of federal benefit 479
Other 313 9
Total income tax expense (benefit) on
continuing operations $(73) $(422) $ 431
Effective tax rate on continuing operations N.M.* 29.5% 30.8%
* Not meaningful.
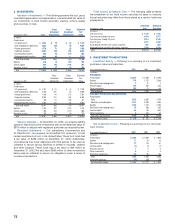
Major Components of Deferred Income Taxes on Our Balance
Sheet — Differences between the tax basis of assets and liabilities
and their reported amounts in the consolidated financial statements
that will result in taxable or deductible amounts in future years are
called temporary differences.The tax effects of temporary differences
that give rise to the deferred tax assets and deferred tax liabilities are
presented in the following table.
December 31 2002 2001
(In millions)
DEFERRED TAX ASSETS
Loss reserves $715 $792
Unearned premium reserves 182 193
Alternative minimum tax credit carryforwards 79 124
Net operating loss carryforwards 909 496
Deferred compensation 114 113
Other 514 612
Total gross deferred tax assets 2,513 2,330
Less valuation allowance (133) (106)
Net deferred tax assets 2,380 2,224
DEFERRED TAX LIABILITIES
Unrealized appreciation of investments 326 218
Deferred acquisition costs 178 218
Real estate 102 132
Prepaid compensation 141 92
Other 366 316
Total gross deferred tax liabilities 1,113 976
Total deferred income taxes $1,267 $1,248
The St. Paul Companies 2002 Annual Report 75