Travelers 2002 Annual Report Download - page 83
Download and view the complete annual report
Please find page 83 of the 2002 Travelers annual report below. You can navigate through the pages in the report by either clicking on the pages listed below, or by using the keyword search tool below to find specific information within the annual report.-
 1
1 -
2
-
3
-
4
-
5
-
6
-
7
-
8
-
9
-
10
-
11
-
12
-
13
-
14
-
15
-
16
-
17
-
18
-
19
-
20
-
21
-
22
-
23
-
24
-
25
-
26
-
27
-
28
-
29
-
30
-
31
-
32
-
33
-
34
-
35
-
36
-
37
-
38
-
39
-
40
-
41
-
42
-
43
-
44
-
45
-
46
-
47
-
48
-
49
-
50
-
51
-
52
-
53
-
54
-
55
-
56
-
57
-
58
-
59
-
60
-
61
-
62
-
63
-
64
-
65
-
66
-
67
-
68
-
69
-
70
-
71
-
72
-
 73
73 -
 74
74 -
 75
75 -
 76
76 -
 77
77 -
 78
78 -
 79
79 -
 80
80 -
 81
81 -
 82
82 -
 83
83 -
 84
84 -
 85
85 -
 86
86 -
 87
87 -
 88
88 -
 89
89 -
 90
90 -
 91
91 -
 92
92 -
 93
93 -
94
-
95
-
96
-
97
-
98
-
99
-
100
 |
 |

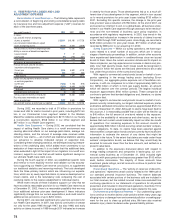
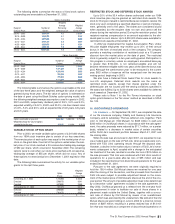
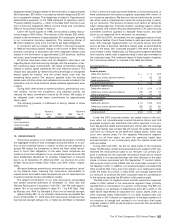
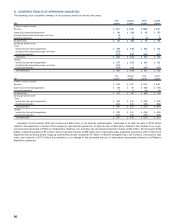
The following tables summarize the status of fixed stock options
outstanding and exercisable at December 31, 2002.
Options Outstanding
Weighted
Average Weighted
Range of Number of Remaining Average
Exercise Prices Options Contractual Life Exercise Price
$18.43 – 29.63 3,007,674 4.5 $ 27.31
30.19 – 35.00 1,969,279 6.1 31.47
35.25 – 42.94 3,677,825 7.0 35.99
43.13 – 44.21 3,797,379 8.3 44.07
44.35 – 48.04 3,229,673 8.4 45.81
48.39 – 50.44 3,339,173 7.8 48.47
$18.43 – 50.44 19,021,003 7.2 $ 39.62
Options Exercisable
Weighted
Range of Number of Average
Exercise Prices Options Exercise Price
$18.43 – 29.63 2,474,414 $ 26.85
30.19 – 35.00 1,471,887 31.56
35.25 – 42.94 1,269,119 36.93
43.13 – 44.21 780,360 43.57
44.35 – 48.04 779,503 45.48
48.39 – 50.44 1,114,077 48.49
$18.43 – 50.44 7,889,360 $ 35.90
The following table summarizes the options exercisable at the end
of the last three years and the weighted average fair value of options
granted during those years. The fair value of options is estimated on
the date of grant using the Black-Scholes option-pricing model, with
the following weighted-average assumptions used for grants in 2002,
2001 and 2000, respectively: dividend yield of 2.9%, 3.0% and 3.0%;
expected volatility of 34.2%, 33.8% and 30.0%; risk-free interest rates
of 4.9%, 5.0% and 6.5%; and an expected life of 6.9 years, 6.8 years
and 6.5 years.
2002 2001 2000
Options exercisable at year-end 7,889,360 5,982,799 5,751,780
Weighted average fair value of options
granted during the year $14.02 $14.94 $ 10.58
VARIABLE STOCK OPTION GRANT
Prior to 2000, we made variable option grants of 2,341,800 shares
from our 1994 stock incentive plan to certain of our key executives.
The exercise price of each option was equal to the market price of our
stock on the grant date. One-half of the options vested when the mar-
ket price of our stock reached a 20-consecutive-trading-day average
of $50 per share, which occurred in November 2000. The remaining
options were to vest when our stock price reached a 20-consecutive-
trading-day average of $55 per share, which did not occur. Any of
these options not exercised prior to December 1, 2001 expired on that
date.
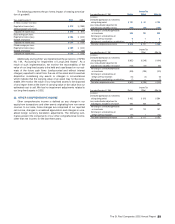
The following table summarizes the activity for our variable option
grants for the last three years.
Weighted
Option Average
Shares Exercise Price
Outstanding Jan. 1, 2000 1,720,800 $ 30.20
Exercised (290,975) 30.41
Canceled (437,850) 29.59
Outstanding Dec. 31, 2000 991,975 30.15
Exercised (290,500) 29.74
Canceled (701,475) 30.32
Outstanding Dec. 31, 2001 — $ —
RESTRICTED STOCK AND DEFERRED STOCK AWARDS
Up to 20% of the 33.4 million shares authorized under our 1994
stock incentive plan may be granted as restricted stock awards. The
stock for this type of award is restricted because recipients receive the
stock only upon completing a specified objective or period of employ-
ment, generally one to five years. The shares are considered issued
when awarded, but the recipient does not own and cannot sell the
shares during the restriction period. During the restriction period, the
recipient receives compensation in an amount equivalent to the divi-
dends paid on such shares. Up to 5,500,000 shares were available for
restricted stock awards at December 31, 2002.
In 2002 we implemented the Capital Accumulation Plan. Under
this plan eligible employees may receive up to 25% of their annual
bonus in the form of restricted stock of the company. The company
provides a matching contribution of restricted stock at a 10 percent
discount from the market price on the date of grant. The restricted
stock is generally subject to a two-year vesting period. Participation in
this program is voluntary unless an employee’s annualized base pay
is greater than $100,000, is not retirement-eligible and will not
become retirement-eligible within two years of the date the bonus was
paid. Although the “performance year” to be measured is the current
year, $8.5 million of expense will be recognized over the two-year
vesting period, beginning in 2003.
We also have a Deferred Stock Award Plan for stock awards to
non-U.S. employees. Deferred stock awards are the same as
restricted stock awards, except that shares granted under the
deferred plan are not issued until the vesting conditions specified in
the award are fulfilled. Up to 3,000 shares were available for deferred
stock awards at December 31, 2002.
Please refer to Note 1 for the Pro Forma information on stock
option grants based on the “fair value” method as described in SFAS
No. 123.
16. DISCONTINUED OPERATIONS
Life Insurance — On September 28, 2001, we completed the sale
of our life insurance company, Fidelity and Guaranty Life Insurance
Company, and its subsidiary, Thomas Jefferson Life, (together, “F&G
Life”) to Old Mutual plc (“Old Mutual”) for $335 million in cash and
$300 million in Old Mutual shares. In accordance with the sale agree-
ment, the sales proceeds were reduced by $11.7 million, on a pretax
basis, related to a decrease in market value of certain securities
within F&G Life’s investment portfolio between March 31, 2001 and
the closing date.
When the sale was announced in April 2001, we expected to real-
ize a modest gain on the sale of F&G Life, when proceeds were com-
bined with F&G Life’s operating results through the disposal date.
However, a decline in the market value of certain of F&G Life’s invest-
ments subsequent to April, coupled with a change in the anticipated
tax treatment of the sale, resulted in an after-tax loss of $74 million on
the sale proceeds. That loss was combined with F&G Life’s results of
operations for a year-to-date after-tax loss of $55 million and was
included in the reported loss from discontinued operations for the year
ended December 31, 2001.
Pursuant to the sale agreement, we were originally required to
hold the 190.4 million Old Mutual shares we received for one year
after the closing of the transaction, and the proceeds from the sale of
F&G Life were subject to possible adjustment based on the move-
ment of the market price of Old Mutual’s shares at the end of the one-
year period.The amount of possible adjustment was to be determined
by a derivative “collar” agreement included in the sale agreement. In
May 2002, Old Mutual granted us a release from the one-year hold-
ing requirement in order to facilitate our sale of those shares in a
placement made outside the United States, together with a concur-
rent sale of shares by Old Mutual by means of an overallotment
option, which was exercised by the underwriters.We sold all of the Old
Mutual shares we were holding on June 6, 2002 for a total net consid-
eration of $287 million, resulting in a pretax realized loss of $13 mil-
lion that was recorded as a component of discontinued operations on
The St. Paul Companies 2002 Annual Report 81