Travelers 2002 Annual Report Download - page 81
Download and view the complete annual report
Please find page 81 of the 2002 Travelers annual report below. You can navigate through the pages in the report by either clicking on the pages listed below, or by using the keyword search tool below to find specific information within the annual report.-
 1
1 -
2
-
3
-
4
-
5
-
6
-
7
-
8
-
9
-
10
-
11
-
12
-
13
-
14
-
15
-
16
-
17
-
18
-
19
-
20
-
21
-
22
-
23
-
24
-
25
-
26
-
27
-
28
-
29
-
30
-
31
-
32
-
33
-
34
-
35
-
36
-
37
-
38
-
39
-
40
-
41
-
42
-
43
-
44
-
45
-
46
-
47
-
48
-
49
-
50
-
51
-
52
-
53
-
54
-
55
-
56
-
57
-
58
-
59
-
60
-
61
-
62
-
63
-
64
-
65
-
66
-
67
-
68
-
69
-
70
-
 71
71 -
 72
72 -
 73
73 -
 74
74 -
 75
75 -
 76
76 -
 77
77 -
 78
78 -
 79
79 -
 80
80 -
 81
81 -
 82
82 -
 83
83 -
 84
84 -
 85
85 -
 86
86 -
 87
87 -
 88
88 -
 89
89 -
 90
90 -
 91
91 -
92
-
93
-
94
-
95
-
96
-
97
-
98
-
99
-
100
 |
 |

Postretirement Benefits Other Than Pension — We provide certain
health care and life insurance benefits for retired employees (and their
eligible dependents), who have elected to remain subject to the tradi-
tional formula. We currently anticipate that most covered employees
will become eligible for these benefits if they retire while working for
us. The cost of these benefits is shared with the retiree. The benefits
are generally provided through our employee benefits trust, to which
periodic contributions are made to cover benefits paid during the year.
We accrue postretirement benefits expense during the period of the
employee’s service.
A health care inflation rate of 9.00% was assumed to change to
8.00% in 2003; decrease one percent annually to 5.00% in 2006; and
then remain at that level. A one-percentage-point change in assumed
health care cost trend rates would have the following effects.
1-Percentage- 1-Percentage-
Point Increase Point Decrease
(In millions)
Effect on total of service and interest
cost components $ 2 $ (2)
Effect on postretirement benefit obligation $ 23 $ (19)
For those employees covered under the cash balance retiree
health formula, we maintain a cash balance retiree health account
(“health account”) to measure the amount of benefits payable to an
employee. For each plan year an employee is an active participant,
the health account is increased for pay credits and interest credits.
Pay credits are calculated based on pensionable earnings up to the
Social Security taxable wage base for the plan year and added to the
health account on the first day of the next plan year. Interest credits
are added at the end of each calendar quarter.
These benefits vest after five years of service. If an employee is
vested under the cash balance formula when their employment with
us ends, they are eligible to receive the amount in their health
account. Our obligations under this plan are accounted for under, and
included in the 2002 results of, the defined benefit pension plan.
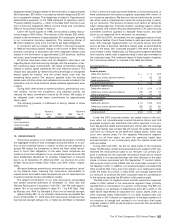
All Plans — The following tables provide a reconciliation of the
changes in the plans’ benefit obligations and fair value of assets over
the two-year period ended December 31, 2002, and a statement of
the funded status as of December 31, of 2002 and 2001.
Pension Postretirement
Benefits Benefits
2002 2001 2002 2001
($ in millions)
Change in benefit obligation:
Benefit obligation at beginning of year $1,013 $995 $211 $221
Service cost 39 35 54
Interest cost 69 67 18 15
Plan amendment (84) 3(22) —
Actuarial (gain) loss 48 (47) 45 11
Foreign currency exchange rate change 4———
Acquisition ————
Benefits paid (79) (64) (16) (16)
Curtailment loss (gain) 824 (9) (24)
Benefit obligation at end of year $1,018 $1,013 $ 232 $211
Change in plan assets:
Fair value of plan assets at beginning of year $1,048 $1,234 $24 $23
Actual return on plan assets (86) (126) 31
Foreign currency exchange rate change 4———
Acquisition ————
Employer contribution 158 416 16
Benefits paid (79) (64) (16) (16)
Fair value of plan assets at end of year $1,045 $1,048 $27 $24
Funded status (at December 31) $26 $35 $(205) $(187)
Unrecognized transition asset ————
Unrecognized prior service cost (benefit) (83) 1(20) 2
Unrecognized net actuarial loss 468 243 57 16
Prepaid (accrued) benefit cost $411 $279 $(168) $(169)
Weighted average assumptions
as of December 31:
Discount rate 6.50% 7.00% 6.50% 7.00%
Expected return on plan assets 8.50% 10.00% 6.00% 7.00%
Rate of compensation increase 4.00% 4.00% 4.00% 4.00%
The St. Paul Companies 2002 Annual Report 79
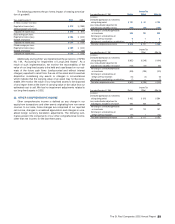
The following table provides the components of our net periodic benefit cost for the years 2002, 2001 and 2000.
Pension Benefits Postretirement Benefits
2002 2001 2000 2002 2001 2000
(In millions)
Components of net periodic benefit cost:
Service cost $39 $35 $ 28 $5 $4 $5
Interest cost 69 67 63 18 15 14
Expected return on plan assets (104) (122) (125) (2) (2) (2)
Amortization of transition asset —(1) (2) ———
Amortization of prior service cost —(3) (3) ——1
Recognized net actuarial loss (gain) 13 4(2) 3——
Net periodic pension cost (income) 17 (20) (41) 24 17 18
Curtailment loss (gain) 917 — (9) (17) —
Net periodic benefit cost (income) after curtailment $26 $(3) $ (41) $15 $— $18