Travelers 2002 Annual Report Download - page 56
Download and view the complete annual report
Please find page 56 of the 2002 Travelers annual report below. You can navigate through the pages in the report by either clicking on the pages listed below, or by using the keyword search tool below to find specific information within the annual report.-
 1
1 -
2
-
3
-
4
-
5
-
6
-
7
-
8
-
9
-
10
-
11
-
12
-
13
-
14
-
15
-
16
-
17
-
18
-
19
-
20
-
21
-
22
-
23
-
24
-
25
-
26
-
27
-
28
-
29
-
30
-
31
-
32
-
33
-
34
-
35
-
36
-
37
-
38
-
39
-
40
-
41
-
42
-
43
-
44
-
45
-
 46
46 -
 47
47 -
 48
48 -
 49
49 -
 50
50 -
 51
51 -
 52
52 -
 53
53 -
 54
54 -
 55
55 -
 56
56 -
 57
57 -
 58
58 -
 59
59 -
 60
60 -
 61
61 -
 62
62 -
 63
63 -
 64
64 -
 65
65 -
 66
66 -
67
-
68
-
69
-
70
-
71
-
72
-
73
-
74
-
75
-
76
-
77
-
78
-
79
-
80
-
81
-
82
-
83
-
84
-
85
-
86
-
87
-
88
-
89
-
90
-
91
-
92
-
93
-
94
-
95
-
96
-
97
-
98
-
99
-
100
 |
 |

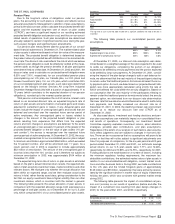
Because of the subjective nature of certain plan assumptions, the
following table presents, for the U.S. plan only, a sensitivity analysis to
hypothetical changes in the LTROR (in 50 basis point increments) and
the discount rate (in 25 basis point increments) on net income for the
year ended December 31, 2002. The results presented in the tables
assume that only the LTROR or discount rate assumption, as applica-
ble for each table, is changed and that all other assumptions remain
constant.
($ in millions) Base
LTROR 8.00% 8.50% 9.00% 9.50% 10.00% 10.50%
Incremental benefit (cost) $ (20) $ (15) $ (10) $ (5) $ — $ 5
Percent of 2002 net income 9% 7% 5% 2% —% 2%
($ in millions) Base
Discount Rate 6.50% 6.75% 7.00% 7.25% 7.50%
Incremental benefit (cost) $ (7) $ (3) $ — $ 3 $ 6
Percent of 2002 net income 3% 1% —% 1% 3%
It is estimated that the December 31, 2002 assumptions will result
in a 2003 pension cost of approximately $29 million for the U.S. plan
only. The impact of the changes in assumptions from December 31,
2001 will be somewhat offset by changes to the plan design effective
December 31, 2002.
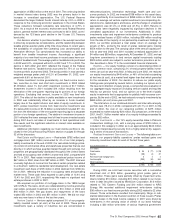
Postretirement Benefits Plan Assumptions
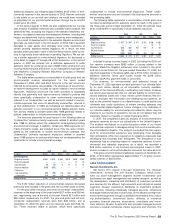
The following table presents our postretirement benefits plan
assumptions as of December 31.
2002 2001 2000
Discount rate 6.50% 7.00% 7.25%
Expected long-term rate of return 6.00% 7.00% 7.00%
Expected rate of compensation increase 4.00% 4.00% 4.00%
Our expected long-term rate of return for our postretirement ben-
efits plan differs from that used for our pension plan due to differences
in the funded assets (fixed maturity investments in our postretirement
benefits plan compared with various investment classes in our pen-
sion plan) used to fund certain of the related obligations.
The following table presents the impact of postretirement expense
(income) on our results of operations (before and after the impact of
curtailment gains resulting from plan design changes in 2002 and
2001) for the years 2002, 2001, and 2000, respectively.
Years Ended December 31 2002 2001 2000
(In millions)
Net periodic benefit cost (income) $24 $17 $18
Curtailment gain (9) (17) —
Net impact after curtailment $15 $— $18
THE ST. PAUL COMPANIES
EXPOSURES TO MARKET RISK
Market risk can be described as the risk of change in fair value of
a financial instrument due to changes in interest rates, equity prices,
creditworthiness, foreign exchange rates or other factors. We seek to
mitigate that risk by a number of actions, as described below.Our poli-
cies to address these risks were unchanged from the previous year.
The only significant changes to our market risk from 2001 were a
reduced allocation of assets to our equity investment portfolio, and a
reduction in the estimated duration of our fixed income investment
portfolio, which includes our consolidated holdings of fixed income
securities, securities on loan and short-term investments.We reduced
our equity holdings from $1.4 billion as of December 31, 2001 to
$394 million as of December 31, 2002.
As discussed in more detail in the Critical Accounting Policies sec-
tion on pages 30 through 32 of this discussion, there are risks and
uncertainties related to our assessment of “other than temporary”
impairments in our investment portfolio.
Interest Rate Risk — Our exposure to market risk for changes in
interest rates is concentrated in our investment portfolio, and to a
54
lesser extent, our debt obligations. However, changes in investment
values attributable to interest rate changes are mitigated by corre-
sponding and partially offsetting changes in the economic value of our
insurance reserves and debt obligations. We monitor this exposure
through periodic reviews of our asset and liability positions. Our esti-
mates of cash flows, as well as the impact of interest rate fluctuations
relating to our investment portfolio and insurance reserves, are mod-
eled and reviewed quarterly. At December 31, 2002, the estimated
duration of our fixed income investment portfolio (as defined above)
was 3.3, compared with 4.0 at December 31, 2001.
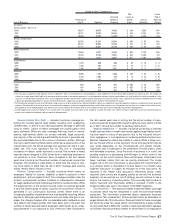
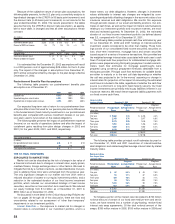
The following table provides principal cash flow estimates by year
for our December 31, 2002 and 2001 holdings of interest-sensitive
investment assets considered to be other than trading. Those hold-
ings consist of our consolidated fixed income securities, securities on
loan, short-term investments, mortgage loans and certain securities
issued as part of a series of insurance transactions.Also provided are
the weighted-average interest rates associated with each year’s cash
flows. Principal cash flow projections for collateralized mortgage obli-
gations were prepared using third-party prepayment models and esti-
mates. Cash flow estimates for mortgage passthroughs were
prepared using consensus prepayment forecasts obtainable from a
third-party provider. Principal cash flow estimates for callable bonds
are either to maturity or to the next call date depending on whether
the call was projected to be “in-the-money” assuming no change in
interest rates. No projection of the impact of reinvesting the estimated
cash flows is included in the table, regardless of whether the cash flow
source is a short-term or long-term fixed maturity security. Our fixed
income investments are primarily held to pay liabilities inherent in our
insurance reserves. We match these expected liability payments with
our fixed income cash flows.
Interest-sensitive
Investment Assets December 31, 2002 December 31, 2001
Weighted Weighted
Period from balance Principal Cash Average Interest Principal Cash Average Interest
sheet date: Flows Rate Flows Rate
($ in millions)
One year $5,988 3.3% $4,416 4.4%
Two years 2,348 6.7% 2,017 6.6%
Three years 2,070 5.9% 1,616 7.5%
Four years 1,950 6.0% 1,454 6.5%
Five years 1,668 5.1% 1,562 6.4%
Thereafter 6,638 5.8% 7,547 6.2%
Total $20,662 $18,612
Fair value $20,614 $18,198
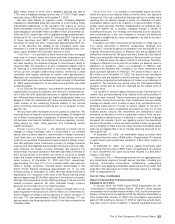
The following table provides principal runoff estimates by year for
our December 31, 2002 and 2001 inventories of interest-sensitive
debt obligations and related weighted average interest rates by stated
maturity dates.
Medium-term Notes,
Zero Coupon Notes
and Senior Notes December 31, 2002 December 31, 2001
Weighted Weighted
Period from balance Principal Cash Average Interest Principal Cash Average Interest
sheet date: Flows Rate Flows Rate
($ in millions)
One year $67 6.5% $49 7.5%
Two years 55 7.1% 67 6.5%
Three years 429 7.5% 54 7.1%
Four years 59 7.0% 429 7.5%
Five years 1,015 5.6% 59 7.0%
Thereafter 562 6.7% 635 6.8%
Total $2,187 $1,293
Fair value $2,293 $1,330
To mitigate a portion of the interest rate risk related to $730 million
notional amount of certain of our fixed rate medium-term and senior
notes, we have entered into a number of pay-floating, receive-fixed
interest rate swap agreements. Of the total notional amount of the
swaps, $330 million mature in 2005, $150 million mature in 2008 and