Travelers 2002 Annual Report Download - page 59
Download and view the complete annual report
Please find page 59 of the 2002 Travelers annual report below. You can navigate through the pages in the report by either clicking on the pages listed below, or by using the keyword search tool below to find specific information within the annual report.-
 1
1 -
2
-
3
-
4
-
5
-
6
-
7
-
8
-
9
-
10
-
11
-
12
-
13
-
14
-
15
-
16
-
17
-
18
-
19
-
20
-
21
-
22
-
23
-
24
-
25
-
26
-
27
-
28
-
29
-
30
-
31
-
32
-
33
-
34
-
35
-
36
-
37
-
38
-
39
-
40
-
41
-
42
-
43
-
44
-
45
-
46
-
47
-
48
-
 49
49 -
 50
50 -
 51
51 -
 52
52 -
 53
53 -
 54
54 -
 55
55 -
 56
56 -
 57
57 -
 58
58 -
 59
59 -
 60
60 -
 61
61 -
 62
62 -
 63
63 -
 64
64 -
 65
65 -
 66
66 -
 67
67 -
 68
68 -
 69
69 -
70
-
71
-
72
-
73
-
74
-
75
-
76
-
77
-
78
-
79
-
80
-
81
-
82
-
83
-
84
-
85
-
86
-
87
-
88
-
89
-
90
-
91
-
92
-
93
-
94
-
95
-
96
-
97
-
98
-
99
-
100
 |
 |

The St. Paul Companies 2002 Annual Report 57
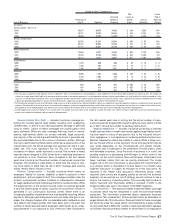
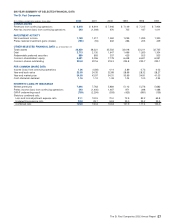
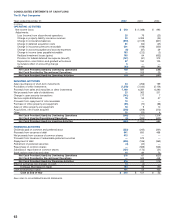
SIX-YEAR SUMMARY OF SELECTED FINANCIAL DATA
The St. Paul Companies
($ in millions, except ratios and per share data) 2002 2001 2000 1999 1998 1997
CONSOLIDATED
Revenues from continuing operations $8,918 $8,919 $ 7,946 $ 7,149 $ 7,315 $ 7,904
After-tax income (loss) from continuing operations 243 (1,009) 970 705 187 1,011
INVESTMENT ACTIVITY
Net investment income 1,169 1,217 1,262 1,259 1,295 1,320
Pretax realized investment gains (losses) (165) (94) 632 286 203 409
OTHER SELECTED FINANCIAL DATA (as of December 31)
Totals assets 39,920 38,321 35,502 33,418 33,211 32,735
Debt 2,713 2,130 1,647 1,466 1,260 1,304
Redeemable preferred securities 889 893 337 425 503 503
Common shareholders’ equity 5,681 5,056 7,178 6,448 6,621 6,591
Common shares outstanding 226.8 207.6 218.3 224.8 233.7 233.1
PER COMMON SHARE DATA
Income (loss) from continuing operations 1.06 (4.84) 4.14 2.89 0.73 4.02
Year-end book value 25.05 24.35 32.88 28.68 28.32 28.27
Year-end market price 34.05 43.97 54.31 33.69 34.81 41.03
Cash dividends declared 1.16 1.12 1.08 1.04 1.00 0.94
PROPERTY-LIABILITY INSURANCE
Written premiums 7,046 7,763 5,884 5,112 5,276 5,682
Pretax income (loss) from continuing operations 243 (1,400) 1,467 971 298 1,488
GAAP underwriting result (709) (2,294) (309) (425) (881) (139)
Statutory combined ratio:
Loss and loss adjustment expense ratio 81.1 102.5 70.0 72.9 82.2 69.8
Underwriting expense ratio 28.8 28.1 34.8 35.0 35.2 33.5
Combined ratio 109.9 130.6 104.8 107.9 117.4 103.3