Travelers 2002 Annual Report Download - page 52
Download and view the complete annual report
Please find page 52 of the 2002 Travelers annual report below. You can navigate through the pages in the report by either clicking on the pages listed below, or by using the keyword search tool below to find specific information within the annual report.-
 1
1 -
2
-
3
-
4
-
5
-
6
-
7
-
8
-
9
-
10
-
11
-
12
-
13
-
14
-
15
-
16
-
17
-
18
-
19
-
20
-
21
-
22
-
23
-
24
-
25
-
26
-
27
-
28
-
29
-
30
-
31
-
32
-
33
-
34
-
35
-
36
-
37
-
38
-
39
-
40
-
41
-
 42
42 -
 43
43 -
 44
44 -
 45
45 -
 46
46 -
 47
47 -
 48
48 -
 49
49 -
 50
50 -
 51
51 -
 52
52 -
 53
53 -
 54
54 -
 55
55 -
 56
56 -
 57
57 -
 58
58 -
 59
59 -
 60
60 -
 61
61 -
 62
62 -
63
-
64
-
65
-
66
-
67
-
68
-
69
-
70
-
71
-
72
-
73
-
74
-
75
-
76
-
77
-
78
-
79
-
80
-
81
-
82
-
83
-
84
-
85
-
86
-
87
-
88
-
89
-
90
-
91
-
92
-
93
-
94
-
95
-
96
-
97
-
98
-
99
-
100
 |
 |

company markets its capabilities under four distinct brands: NWQ, a
leader in value-style equities; Nuveen Investments, a leader in tax-
free investments; Rittenhouse, a leader in growth-style equities; and
Symphony, a leading institutional manager of market-neutral alterna-
tive investment portfolios. Nuveen Investments is listed on the New
York Stock Exchange, trading under the symbol “JNC.”
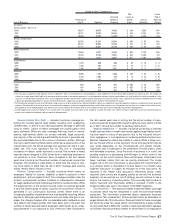
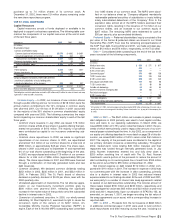
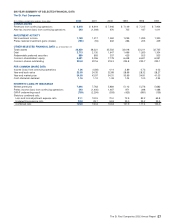
The following table summarizes Nuveen Investments’ key financial
data for the last three years.
Years Ended December 31 2002 2001 2000
(In millions)
Revenues $397 $378 $ 376
Expenses 190 190 201
Pretax income 207 188 175
Minority interest (45) (46) (40)
The St. Paul’s share of pretax income $162 $142 $ 135
Assets under management $79,719 $68,485 $ 62,011
Nuveen Investments’ primary business activities generate three
principal sources of revenue: (1) advisory fees earned on assets
under management, including separately managed accounts,
exchange-traded funds and mutual funds; (2) underwriting and distri-
bution revenues earned upon the sale of certain investment products
and (3) performance fees earned on certain institutional accounts
based on the performance of such accounts.Advisory fees accounted
for 90% of Nuveen Investments’ total revenues in 2002.
Acquisitions — In August 2002, Nuveen Investments acquired
NWQ Investment Management Company, Inc. (“NWQ”), an asset
management firm based in Los Angeles with approximately $6.9 bil-
lion of assets under management in both retail and institutional man-
aged accounts.NWQ specializes in value-oriented equity investments
and has significant relationships among institutions and financial advi-
sors. The NWQ purchase price includes up to an additional $20 mil-
lion payable to the seller over a five-year period under terms of a
strategic alliance agreement.The purchase price was funded through
a combination of available cash and borrowings under an intercom-
pany credit facility between The St. Paul and Nuveen Investments.
In July 2001, Nuveen Investments acquired Symphony Asset
Management LLC (“Symphony”), an institutional investment manager
based in San Francisco with approximately $4 billion in assets under
management. The acquisition of Symphony expanded Nuveen
Investment’s product offerings to include managed accounts and
funds designed to reduce risk through market-neutral and other
strategies for institutional investors.
2002 vs. 2001 — Gross sales of investment products totaled
$15.6 billion in 2002, a 10% increase over sales of $14.2 billion in
2001. The growth over 2001 was driven by an increase in exchange-
traded fund sales. Municipal mutual fund sales and institutional man-
aged account sales also increased over 2001. Sales of retail
managed accounts declined, as the addition of NWQ value accounts
was more than offset by a reduction in equity growth account sales.
Defined portfolio sales also declined in 2002, due to Nuveen
Investments’ decision to exit this product line in 2002.Net flows (equal
to the sum of sales, reinvestments and exchanges, less redemptions)
totaled $7.3 billion in 2002, down 5% from comparable 2001 net flows
of $7.7 billion. Net flows were positive across all product categories in
2002 — managed accounts, exchange-traded funds and mutual
funds. Nuveen Investments introduced 18 municipal closed-end
exchange-traded funds in 2002, which, combined with municipal
mutual funds and managed accounts, raised $4.8 billion in net new
assets for the year. In addition, Nuveen Investments launched the first
Preferred Stock closed-end exchange-traded fund in the industry,
generating approximately $4 billion in sales.
Assets under management at the end of 2002 totaled $79.7 billion,
up 16% over the year-end 2001 total of $68.5 billion.The NWQ acqui-
sition accounted for approximately $7 billion of the increase, with the
remainder due to strong net flows that more than offset equity market
declines. Managed assets at the end of the year were comprised of
$39.9 billion of exchange-traded funds, $19.4 billion of retail managed
50
accounts, $8.5 billion of institutional managed accounts, and
$11.9 billion of mutual funds.
Investment advisory fees of $356 million in 2002 grew 8% over
2001 fees of $331 million. The addition of Symphony and NWQ
accounted for approximately 6% of the increase, while exchange-
traded funds and other fixed-income products drove the remainder.
Fees on exchange-traded funds grew 10% due to an increase in aver-
age assets under management as a result of both positive net flows
and market appreciation. This increase was partially offset by a
decline in advisory fees related to equity growth accounts, where
assets under management declined due to market depreciation
and withdrawals.
Expenses of $190 million in 2002 were level with 2001. Excluding
the impact of the NWQ and Symphony acquisitions, operating
expenses were down 9% in 2002. The decline was driven by reduc-
tions in compensation and benefits, advertising and promotional
spending, and a decline in goodwill amortization expense due to the
implementation of new accounting rules in 2002.
In July 2002, Nuveen Investments entered into, and borrowed the
total amount available under, a $250 million revolving loan agreement
with The St. Paul, its majority shareholder.The loan facility expires on
July 15, 2003 and carries a floating interest rate of LIBOR plus a mar-
gin of up to 0.25%. A portion of the proceeds from the $250 million
loan was used to repay borrowings under bank facilities, while the
remainder was used to fund the NWQ acquisition.
2001 vs. 2000 — In 2001, gross sales of investment products
increased 32% to $14.2 billion, driven by continuing success with
exchange-traded funds.Nuveen Investments launched 20 new munic-
ipal funds, as well as a REIT-based fund, issuing approximately
$2.8 billion of new municipal exchange-traded fund common shares
and $1.2 billion in Muni/Fund Preferred‘ shares. Managed account
sales grew 39% compared with 2000, and mutual fund sales were
22% higher than 2000, primarily due to an increase in municipal fund
sales.Strong sales in exchange-traded funds, managed accounts and
mutual funds were partially offset by lower equity defined portfolio
sales as a result of equity market volatility, particularly in the technol-
ogy sector. Net flows totaled $7.7 billion in 2001, a 64% increase over
net flows of $4.7 billion in 2000.
Total assets under management grew to $68.5 billion at the end of
2001, compared with $62.0 billion a year earlier. The increase was
due to the addition of Symphony and Nuveen Investments’ strong net
flows for the year. At the end of 2001, managed assets consisted of
$32.0 billion of exchange-traded funds, $24.7 billion of managed
accounts, and $11.8 billion of mutual funds.
Revenue of $378 million in 2001 were slightly higher than in 2000.
Growth in advisory fees of 6%, which occurred as a result of an
increase in average assets under management, was offset by a
decline in distribution revenue related to lower defined portfolio sales.
Expenses for the year declined 5%. Excluding the impact of the
Symphony acquisition, operating expenses declined 9%. The decline
from 2000 was largely due to a reduction in advertising and promo-
tional spending, which had been higher in 2000 due to Nuveen
Investments’ brand awareness campaign.
During 2001, Nuveen Investments utilized a portion of its $250 mil-
lion bank revolving line of credit for general corporate purposes,
including day-to-day cash requirements, share repurchases and fund-
ing a portion of the $208 million acquisition of Symphony. At the end
of 2001, $183 million was outstanding under the line of credit.
Share Repurchases — Nuveen Investments repurchased com-
mon shares from minority shareholders in 2002, 2001 and 2000 for
total costs of $151 million, $172 million and $51 million, respectively.
No shares were repurchased from The St. Paul in those years. Our
percentage ownership in Nuveen Investments grew from 78% in 2000
to 79% at the end of 2002, as the share repurchases were substan-
tially offset by Nuveen Investments’ issuance of additional shares
under various stock option and incentive plans and the issuance of
common shares upon the conversion of a portion of its preferred
stock.As part of a new share repurchase program approved in August
2002, Nuveen Investments had authority from its board of directors to