Travelers 2002 Annual Report Download - page 45
Download and view the complete annual report
Please find page 45 of the 2002 Travelers annual report below. You can navigate through the pages in the report by either clicking on the pages listed below, or by using the keyword search tool below to find specific information within the annual report.-
 1
1 -
2
-
3
-
4
-
5
-
6
-
7
-
8
-
9
-
10
-
11
-
12
-
13
-
14
-
15
-
16
-
17
-
18
-
19
-
20
-
21
-
22
-
23
-
24
-
25
-
26
-
27
-
28
-
29
-
30
-
31
-
32
-
33
-
34
-
 35
35 -
 36
36 -
 37
37 -
 38
38 -
 39
39 -
 40
40 -
 41
41 -
 42
42 -
 43
43 -
 44
44 -
 45
45 -
 46
46 -
 47
47 -
 48
48 -
 49
49 -
 50
50 -
 51
51 -
 52
52 -
 53
53 -
 54
54 -
 55
55 -
56
-
57
-
58
-
59
-
60
-
61
-
62
-
63
-
64
-
65
-
66
-
67
-
68
-
69
-
70
-
71
-
72
-
73
-
74
-
75
-
76
-
77
-
78
-
79
-
80
-
81
-
82
-
83
-
84
-
85
-
86
-
87
-
88
-
89
-
90
-
91
-
92
-
93
-
94
-
95
-
96
-
97
-
98
-
99
-
100
 |
 |

As part of the strategic review that led to our decision to exit the
medical liability business, our analysis of the remaining goodwill asset
of $64 million related to the MMI acquisition indicated that approxi-
mately $56 million of that goodwill was not recoverable, and that
amount was written off in the fourth quarter of 2001. The remaining
goodwill deemed recoverable was related to that portion of MMI’s
ongoing consulting business that was not placed in runoff.
PROPERTY-LIABILITY INSURANCE OPERATIONS
Reinsurance
In the years prior to 2002, our Reinsurance segment (“St. Paul Re”)
generally underwrote treaty and facultative reinsurance for property,
liability, ocean marine, surety, certain specialty classes of coverage,
and “nontraditional” reinsurance, which provided limited traditional
underwriting risk protection combined with financial risk protection. In
late 2001, we announced our intention to cease underwriting certain
types of reinsurance coverages and narrow our geographic presence
in 2002, as described in more detail on page 23 of this report. As a
result, in January 2002, St. Paul Re began focusing almost exclusively
on the following types of reinsurance coverage: property catastrophe,
excess-of-loss casualty, marine and traditional finite. St. Paul Re con-
ducted its business through four business centers: North American
Casualty, North American Property, International and Finite Risk. As
discussed in more detail on page 24 of this discussion, in November
2002, we transferred our ongoing reinsurance operations to Platinum
Underwriters Holdings, Ltd. (“Platinum”) while retaining liabilities gen-
erally for reinsurance contracts incepting prior to January 1, 2002.
Reported results for 2002 in this segment represent activity from the
period January 1, 2002 up to the date of transfer to Platinum, includ-
ing premium adjustments and loss development on reinsurance busi-
ness underwritten in prior years.
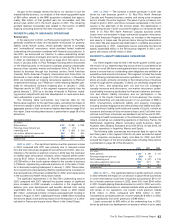
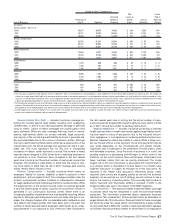
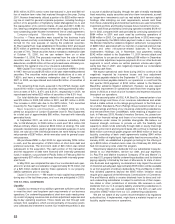
The following table summarizes key financial data for the
Reinsurance segment for the last three years, excluding the impact of
the terrorist attack in 2002 and 2001, and the impact on all years of the
aggregate excess-of-loss reinsurance treaties described on page 36 of
this report. Data including these factors is presented on page 36 of this
discussion.
Years Ended December 31 2002 2001 2000
($ in millions)
Written premiums $751 $1,588 $ 1,208
Percentage change from prior year (53)% 31%
Underwriting result $40 $(269) $ (242)
Loss and loss adjustment expense ratio 66.2 85.5 85.4
Underwriting expense ratio 30.7 32.2 35.3
Combined ratio 96.9 117.7 120.7
2002 vs. 2001 — The significant decline in written premium volume
in 2002 compared with 2001 was primarily due to reduced volume
from the lines of business targeted for exit at the end of 2001. Also con-
tributing to the decline in premium volume in 2002 was the rescission
of several large reinsurance contracts, which reduced written premi-
ums by $137 million. In addition, St. Paul Re ceded written premiums
of $158 million in the fourth quarter related to the transfer of business
to Platinum, representing unearned premiums as of the date of trans-
fer on business incepting subsequent to January 1, 2002.These reduc-
tions in premiums were partially offset by significant price increases on
the narrowed lines of business underwritten in 2002, and new business
in the accident and health reinsurance market.
The significant improvement in St. Paul Re’s underwriting result in
2002 compared with 2001 reflected the positive impact of significant
price increases on 2002 renewals, a reduction in the magnitude of
adverse prior year development and benefits derived from exiting
unprofitable lines of business. Catastrophe losses in 2002 totaled
$31 million, comprised primarily of losses associated with flooding in
Europe in August. In 2001, catastrophe losses of $66 million (excluding
the terrorist attack) were driven by losses from the explosion of a chem-
ical plant in France and tropical storm Allison in the United States.
2001 vs. 2000 — The increase in written premiums in 2001 was
driven by new business growth in St. Paul Re’s North American
Casualty and Property business centers and strong price increases
across virtually the entire segment. The pace of price increases con-
tinued to grow in 2001, and those increases accelerated in the fourth
quarter in the aftermath of the terrorist attack. The deterioration in
underwriting results in 2001 occurred throughout our reinsurance seg-
ment. In St. Paul Re’s North American Casualty business center,
losses were concentrated in large commercial program reinsurance.
For North American Property business, an increase in the frequency
and severity of losses was the primary factor driving the deterioration
from 2000. We also experienced deterioration in satellite and aviation
loss experience in 2001. Catastrophe losses (excluding the terrorist
attack) totaled $66 million in the Reinsurance segment in 2001, com-
pared with losses of $135 million in 2000.
PROPERTY-LIABILITY INSURANCE OPERATIONS
Other
Our Other segment was formed in the fourth quarter of 2002 upon
the revision of our segment reporting structure and is considered to be
entirely in runoff.We have a management team in place for these oper-
ations to ensure that our outstanding claim obligations are settled in an
expeditious and economical manner.This segment includes the results
of the following international insurance operations: 1) our runoff oper-
ations at Lloyd’s, primarily consisting of the following lines of business
written through seven syndicates, in which our ownership ranged from
32% to 100%, and comprising both U.S. and non-U.S. coverages:
casualty insurance and reinsurance, non-marine reinsurance, profes-
sional liability insurance (particularly for financial customers, and direc-
tors’ and officers’ liability insurance) and our participation in the
insuring of the Lloyd’s Central Fund; 2) Unionamerica, the London-
based underwriting unit acquired as part of our purchase of MMI in
2000. Unionamerica underwrote liability and property coverages,
including medical malpractice and other professional liability and direc-
tors’ and officers’ liability, both inside and outside of Lloyd’s, on both an
insurance and excess-of-loss reinsurance basis; and 3) all other inter-
national runoff lines of business we decided to exit at the end of 2001,
consisting of health care business in the United Kingdom, Canada and
Ireland, as well as our underwriting operations in Germany, France, the
Netherlands, Argentina, Mexico (excluding surety business), Spain,
Australia, New Zealand, Botswana and South Africa. (In late 2002, we
sold our operations in Argentina, Mexico and Spain).
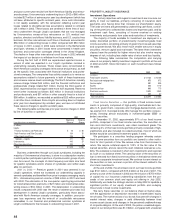
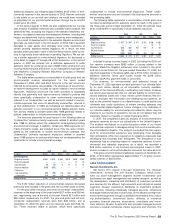
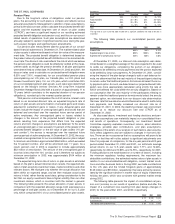
The following table summarizes key financial data for each of the
last three years in this segment. Data for all years exclude the impact
of the corporate reinsurance treaty, and data for 2002 and 2001
exclude the impact of the terrorist attack. Data including these factors
is presented on page 36 of this discussion.
Years Ended December 31 2002 2001 2000
($ in millions)
Written premiums $242 $597 $ 419
Percentage change from prior year (59)% 42%
GAAP underwriting result $(215) $(227) $ (178)
Loss and loss adjustment expense ratio 124.7 107.1 109.1
Underwriting expense ratio 39.0 31.1 34.4
Combined ratio 163.7 138.2 143.5
2002 vs. 2001 — The significant decline in written premium volume
in 2002 reflected the impact of our decision to place these businesses
in runoff. International runoff lines of business accounted for $110 mil-
lion of written premium volume in 2002, down 54% from $240 million
in 2001. Despite placing these businesses in runoff in 2002, we contin-
ued to underwrite business in selected markets while we attempted to
sell certain of our operations. Our Lloyd’s runoff premium totaled
$114 million in 2002, compared with $253 million in 2001.
Unionamerica syndicate premium volume totaled $18 million in 2002,
down significantly from 2001 premiums of $99 million.
Lloyd’s accounted for $99 million of the underwriting loss in 2002,
driven by adverse loss development on business written in prior years
The St. Paul Companies 2002 Annual Report 43