Travelers 2002 Annual Report Download - page 35
Download and view the complete annual report
Please find page 35 of the 2002 Travelers annual report below. You can navigate through the pages in the report by either clicking on the pages listed below, or by using the keyword search tool below to find specific information within the annual report.-
 1
1 -
2
-
3
-
4
-
5
-
6
-
7
-
8
-
9
-
10
-
11
-
12
-
13
-
14
-
15
-
16
-
17
-
18
-
19
-
20
-
21
-
22
-
23
-
24
-
 25
25 -
 26
26 -
 27
27 -
 28
28 -
 29
29 -
 30
30 -
 31
31 -
 32
32 -
 33
33 -
 34
34 -
 35
35 -
 36
36 -
 37
37 -
 38
38 -
 39
39 -
 40
40 -
 41
41 -
 42
42 -
 43
43 -
 44
44 -
 45
45 -
46
-
47
-
48
-
49
-
50
-
51
-
52
-
53
-
54
-
55
-
56
-
57
-
58
-
59
-
60
-
61
-
62
-
63
-
64
-
65
-
66
-
67
-
68
-
69
-
70
-
71
-
72
-
73
-
74
-
75
-
76
-
77
-
78
-
79
-
80
-
81
-
82
-
83
-
84
-
85
-
86
-
87
-
88
-
89
-
90
-
91
-
92
-
93
-
94
-
95
-
96
-
97
-
98
-
99
-
100
 |
 |

quarter of 2002. That provision was classified as a cumulative effect
of accounting change effective as of January 1, 2002. In accordance
with SFAS No. 142, we restated our results for the first quarter of
2002, reducing net income for that period from the reported $139 mil-
lion, or $0.63 per common share (diluted) to $133 million, or $0.60 per
common share (diluted).
At December 31, 2002, our goodwill and intangible assets totaled
$1.01 billion, compared with $690 million at December 31, 2001. Our
asset management subsidiary, Nuveen Investments, Inc., accounted
for the majority of the $321 million increase, primarily resulting from
its acquisition of NWQ Investment Management Company, Inc. in
2002, additional intangible assets recorded related to its 2001 acqui-
sition of Symphony Asset Management LLC and additional goodwill
recorded at The St. Paul parent company resulting from Nuveen
Investments’ repurchase of common shares from its minority share-
holders. Our acquisition of St. Paul Guarantee in 2002 also con-
tributed to the increase in goodwill and intangible assets over 2001.
See Note 22 to the consolidated financial statements for a schedule
of goodwill and acquired intangible assets.
SFAS No. 144 — During 2002, we also implemented the provi-
sions of SFAS No. 144, “Accounting for Impairment of Long-Lived
Assets”. As a result of implementation, we monitor the recoverability
of the value of our long-lived assets to be held and used based on our
estimate of the future cash flows (undiscounted and without interest
charges) expected to result from the use of each asset and its even-
tual disposition considering any events or changes in circumstances
which indicate that the carrying value of an asset may not be recov-
erable. We monitor the value of our long-lived assets to be disposed
of and report them at the lower of carrying value or fair value less our
estimated cost to sell. We had no impairment adjustments related to
our long-lived assets in 2002.
SFAS No. 133 — On January 1, 2001, we adopted the provisions
of Statement of Financial Accounting Standards (SFAS) No. 133,
“Accounting for Derivative Instruments and Hedging Activities,” as
amended by SFAS Nos. 137 and 138. Provisions of SFAS No. 133
require the recognition of derivatives as either assets or liabilities on
the balance sheet and the measurement of those instruments at fair
value.We have limited involvement with derivative instruments, prima-
rily for purposes of hedging against fluctuations in market indices, for-
eign currency exchange rates and interest rates. We also have
entered into a variety of other financial instruments considered to be
derivatives, but which are not designated as hedges, that we utilize to
minimize the potential impact of market movements in certain invest-
ment portfolios. Our adoption of SFAS No. 133, as amended, did not
have a material impact on our financial position or results of continu-
ing operations.
ELIMINATION OF ONE-QUARTER REPORTING LAG
In 2001, we eliminated the one-quarter reporting lag for our pri-
mary underwriting operations in foreign countries (not including our
operations at Lloyd’s), and now we report the results of those opera-
tions on a current basis. As a result, our consolidated results for 2001
include their results for the fourth quarter of 2000 and all quarters of
2001. The incremental impact on our property-liability operations for
the year ended December 31, 2001 of eliminating the reporting lag,
which consists of the results of these operations for the three months
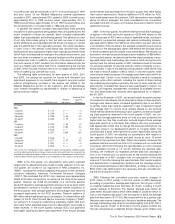
ended December 31, 2001, was as follows.
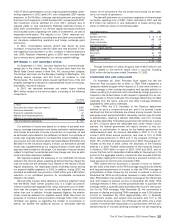
Year Ended
Dec. 31, 2001
(In millions)
Net written premiums $ 71
Net earned premiums $ 86
GAAP underwriting loss $ (45)
Net investment income $ 14
Total pretax loss $ (31)
PROPERTY-LIABILITY INSURANCE OVERVIEW
Note: In the property-liability underwriting analyses and segment
discussions that follow, we sometimes use the term “prior-year loss
development,” which refers to the calendar year income statement
impact of changes in the provision for losses and LAE for claims
incurred in prior accident years. Similarly, we sometimes refer to “cur-
rent-year loss development” or “current accident year loss activity,”
which refers to the calendar year income statement impact of record-
ing the provision for losses and LAE for losses incurred in the current
accident year.
WRITTEN PREMIUMS
As described on page 24 of this discussion, in the fourth quarter
of 2002, we revised our segment reporting structure. Our ongoing
operations are reported in four segments — Specialty Commercial,
Commercial Lines, Surety & Construction, and International & Lloyd’s.
Those operations we consider to be in runoff are reported in three
segments — Health Care, Reinsurance and Other.The following
table presents a reconciliation of our ongoing and runoff segments’
net written premiums to our reported net written premiums for the last
three years.
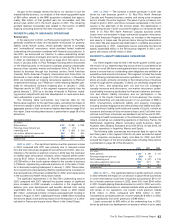
Years Ended December 31 2002 2001 2000
($ in millions)
Ongoing segments:
Net written premiums $5,887 $4,836 $ 3,861
Percentage increase over prior year 22% 25%
Runoff segments:
Net written premiums 1,159 2,927 2,023
Percentage change from prior year (60)% 45%
Consolidated total $7,046 $7,763 $ 5,884
Percentage change from prior year (9)% 32%
Our consolidated net written premiums in 2001 and 2000 included
reductions of $128 million and $474 million, respectively, for premi-
ums ceded under specific reinsurance treaties described in more
detail below. The 2001 total also included $71 million of incremental
premiums from the elimination of the one-quarter reporting lag for cer-
tain of our international operations. Excluding these factors for all
years, our 2002 premium volume of $7.05 billion was 10% lower than
the 2001 adjusted total of $7.82 billion, and that adjusted 2001 total
was 23% higher than the adjusted 2000 total of $6.36 billion. The
decline in 2002 primarily reflected our decision to exit certain lines of
business as described on pages 23 and 24 of this discussion, which
more than offset the impact of strong growth in our ongoing business
segments. In 2001, the increase in premium volume over 2000 was
driven by significant price increases, strong business retention rates
and new business throughout all of our segments.
In our ongoing segments, 2002 premium volume of $5.89 billion
was 21% higher than the 2001 total of $4.87 billion (as adjusted to
eliminate the impact of the reinsurance treaties and reporting lag
adjustment). All four segments recorded strong premium increases,
with the most notable growth occurring in our Surety & Construction
segment (primarily due to strong price increases in Construction, as
well as acquisition-related premium growth in Surety) and in the
Specialty Commercial segment (due to significant price increases and
new business volume in the majority of business centers comprising
the segment). The 2001 total premium volume was 18% higher than
the 2000 total of $4.14 billion (as adjusted to eliminate the impact of
the reinsurance treaties and reporting lag adjustment).
In our runoff segments, 2002 premiums of $1.16 billion were 60%
below the 2001 total of $2.95 billion (as adjusted to eliminate the
impact of the reinsurance treaties and reporting lag adjustment), and
that 2001 total was 33% higher than 2000 premiums of $2.22 billion
(as adjusted to eliminate the impact of the reinsurance treaties). The
substantial decline in 2002 reflected our decision at the end of 2001
to exit those lines of business. The increase in 2001 over 2000 was
centered in our Reinsurance segment, driven by price increases and
The St. Paul Companies 2002 Annual Report 33