Travelers 2002 Annual Report Download - page 53
Download and view the complete annual report
Please find page 53 of the 2002 Travelers annual report below. You can navigate through the pages in the report by either clicking on the pages listed below, or by using the keyword search tool below to find specific information within the annual report.-
 1
1 -
2
-
3
-
4
-
5
-
6
-
7
-
8
-
9
-
10
-
11
-
12
-
13
-
14
-
15
-
16
-
17
-
18
-
19
-
20
-
21
-
22
-
23
-
24
-
25
-
26
-
27
-
28
-
29
-
30
-
31
-
32
-
33
-
34
-
35
-
36
-
37
-
38
-
39
-
40
-
41
-
42
-
 43
43 -
 44
44 -
 45
45 -
 46
46 -
 47
47 -
 48
48 -
 49
49 -
 50
50 -
 51
51 -
 52
52 -
 53
53 -
 54
54 -
 55
55 -
 56
56 -
 57
57 -
 58
58 -
 59
59 -
 60
60 -
 61
61 -
 62
62 -
 63
63 -
64
-
65
-
66
-
67
-
68
-
69
-
70
-
71
-
72
-
73
-
74
-
75
-
76
-
77
-
78
-
79
-
80
-
81
-
82
-
83
-
84
-
85
-
86
-
87
-
88
-
89
-
90
-
91
-
92
-
93
-
94
-
95
-
96
-
97
-
98
-
99
-
100
 |
 |

purchase up to 7.0 million shares of its common stock. At
December 31, 2002, there were 5.9 million shares remaining under
the new share repurchase program.
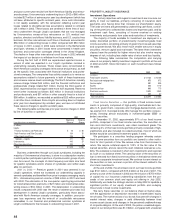
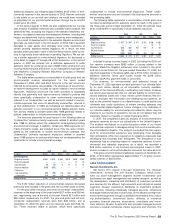
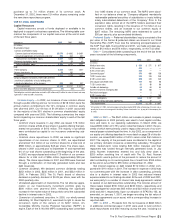
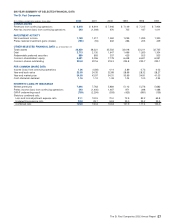
THE ST. PAUL COMPANIES
Capital Resources
Capital resources consist of funds deployed or available to be
deployed to support our business operations.The following table sum-
marizes the components of our capital resources at the end of each
of the last three years.
December 31 2002 2001 2000
($ in millions)
Shareholders’ Equity:
Common shareholders’ equity:
Common stock and retained earnings $5,079 $4,692 $ 6,481
Unrealized appreciation of investments and other 602 364 697
Total common shareholders’ equity 5,681 5,056 7,178
Preferred shareholders’ equity 65 58 49
Total shareholders’ equity 5,746 5,114 7,227
Debt:
Parent company 2,658 1,947 1,647
Nuveen Investments, Inc. 55 183 —
Total debt 2,713 2,130 1,647
Company-obligated mandatorily redeemable preferred
securities of subsidiaries or trusts holding solely
subordinated debentures of the company 889 893 337
Total capitalization $9,348 $8,137 $ 9,211
Ratio of total debt obligations to total capitalization* 29% 26% 18%
*Debt obligations and total capitalization exclude the $65 million and $23 million fair value of interest rate swap
agreements in 2002 and 2001, respectively.
Common Equity — In 2002, our issuance of new common shares
through a public offering and our net income of $218 million were the
primary factors contributing to the 12% increase in common equity
over year-end 2001. Our net loss of $1.09 billion in 2001 accounted
for the majority of the 30% decline in common shareholders’ equity
compared with year-end 2000. The following summarizes the major
factors impacting our common shareholders’ equity in each of the last
three years.
• Common share issuance.In July 2002, we issued 17.8 million
common shares at $24.20 per share in a public offering that gen-
erated net proceeds of $413 million. The majority of proceeds
were contributed as capital to our insurance underwriting sub-
sidiaries.
• Common share repurchases.In 2002, we made no significant
repurchases of our common shares. In 2001, we repurchased
and retired 13.0 million of our common shares for a total cost of
$589 million, or approximately $45 per share. The share repur-
chases in 2001 occurred prior to September 11 and represented
6% of our total shares outstanding at the beginning of the year.
In 2000, we repurchased and retired 17.9 million of our common
shares for a total cost of $536 million (approximately $30 per
share). The share repurchases in 2001 and 2000 were financed
through a combination of internally generated funds and new
debt issuances.
• Common dividends.We declared common dividends totaling
$252 million in 2002, $235 million in 2001, and $232 million in
2000. In February 2003, The St. Paul’s board of directors
declared a quarterly dividend of $0.29 per share, level with the
2002 quarterly rate.
• Unrealized appreciation of investments.The net after-tax appre-
ciation on our fixed-maturity investment portfolio grew by
$300 million over year-end 2001, reflecting the significant
increase in the market value of that portfolio amid the substantial
decline in interest rates in 2002.
• Conversion of preferred securities.In 2000, our wholly-owned
subsidiary, St. Paul Capital LLC, exercised its right to cause the
conversion rights of the owners of its $207 million, 6%
Convertible Monthly Income Preferred Securities (“MIPS”) to
expire. Each of the 4,140,000 MIPS outstanding was convertible
into 1.695 shares of our common stock. The MIPS were classi-
fied on our balance sheet as “Company-obligated mandatorily
redeemable preferred securities of subsidiaries or trusts holding
solely subordinated debentures of the Company.” Prior to the
expiration date, almost all of the MIPS holders exercised their
conversion rights, resulting in the issuance of 7.0 million of our
common shares, and an increase to our common equity of
$207 million. The remaining MIPS were redeemed for cash at
$50 per security, plus accumulated dividends.
Preferred Equity — Preferred shareholders’ equity consisted of the
par value of the Series B preferred shares we issued to our Stock
Ownership Plan (SOP) Trust, less the remaining principal balance of
the SOP Trust debt. During 2002 and 2001, we made principal pay-
ments of $13 million and $14 million, respectively, on the Trust debt.
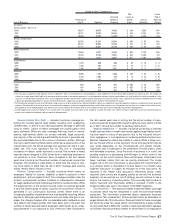
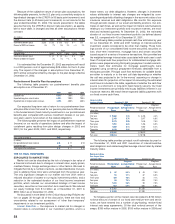
Debt — Consolidated debt outstanding at the end of the last three
years consisted of the following components.
December 31 2002 2001 2000
(In millions)
Medium-term notes $523 $571 $ 617
5.75% senior notes 499 ——
5.25% senior notes 443 ——
Commercial paper* 379 606 138
7.875% senior notes 249 249 249
8.125% senior notes 249 249 249
Zero coupon convertible notes 107 103 98
7.125% senior notes 80 80 80
Variable rate borrowings 64 64 64
Nuveen Investments’ third-party debt 55 183 —
Real estate mortgages —22
8.375% senior notes ——150
Total debt obligations 2,648 2,107 1,647
Fair value of interest rate swap agreements 65 23 —
Total reported debt $2,713 $2,130 $ 1,647
* At December 31, 2002, commercial paper outstanding included $250 million of borrowings that were subse-
quently lent to our asset management subsidiary, Nuveen Investments, Inc., by way of an intercompany line
of credit.
2002 vs. 2001 — The $541 million net increase in parent company
debt obligations in 2002 primarily was used to fund capital contribu-
tions and loans to our operating subsidiaries. In March 2002, we
issued $500 million of 5.75% senior notes that mature in 2007, the pro-
ceeds of which were primarily used to repay a like amount of our com-
mercial paper outstanding at the time. In July 2002, as a component of
our equity unit offering described in more detail on page 28 of this dis-
cussion, we issued $443 million of 5.25% senior notes that mature in
2007. The majority of the proceeds were contributed to the capital of
our primary domestic insurance underwriting subsidiary. Throughout
2002, medium-term notes totaling $49 million matured, and their
repayment was funded through internally generated funds. In July
2002, Nuveen Investments entered into and fully drew down a
$250 million revolving line of credit with The St. Paul. Nuveen
Investments used a portion of the proceeds to reduce the amount of
debt outstanding on its revolving bank line of credit from $183 million
at the end of June 2002 to $55 million at December 31, 2002.
Net interest expense on debt totaled $112 million in 2002, com-
pared with $110 million in 2001.The increase in expense in 2002 was
not commensurate with the increase in debt outstanding, primarily
due to a decline in interest rates in 2002 that reduced interest
expense related to our floating rate debt. At the end of 2002 and 2001,
we were party to a number of interest rate swap agreements related
to several of our debt securities outstanding. The notional amount of
these swaps totaled $730 million and $230 million, respectively, and
their aggregate fair value was $65 million and $23 million at year-end
2002 and 2001, respectively. Upon our adoption of SFAS No. 133, as
amended, on January 1, 2001, we began recording the fair value of
the swap agreements as an asset, with a corresponding increase to
reported debt.
2001 vs. 2000 — Proceeds from the net issuance of $468 million
of additional commercial paper in 2001 were used to fund common
stock repurchases and debt maturing during the year, including our
The St. Paul Companies 2002 Annual Report 51