Travelers 2002 Annual Report Download - page 25
Download and view the complete annual report
Please find page 25 of the 2002 Travelers annual report below. You can navigate through the pages in the report by either clicking on the pages listed below, or by using the keyword search tool below to find specific information within the annual report.-
 1
1 -
2
-
3
-
4
-
5
-
6
-
7
-
8
-
9
-
10
-
11
-
12
-
13
-
14
-
 15
15 -
 16
16 -
 17
17 -
 18
18 -
 19
19 -
 20
20 -
 21
21 -
 22
22 -
 23
23 -
 24
24 -
 25
25 -
 26
26 -
 27
27 -
 28
28 -
 29
29 -
 30
30 -
 31
31 -
 32
32 -
 33
33 -
 34
34 -
 35
35 -
36
-
37
-
38
-
39
-
40
-
41
-
42
-
43
-
44
-
45
-
46
-
47
-
48
-
49
-
50
-
51
-
52
-
53
-
54
-
55
-
56
-
57
-
58
-
59
-
60
-
61
-
62
-
63
-
64
-
65
-
66
-
67
-
68
-
69
-
70
-
71
-
72
-
73
-
74
-
75
-
76
-
77
-
78
-
79
-
80
-
81
-
82
-
83
-
84
-
85
-
86
-
87
-
88
-
89
-
90
-
91
-
92
-
93
-
94
-
95
-
96
-
97
-
98
-
99
-
100
 |
 |

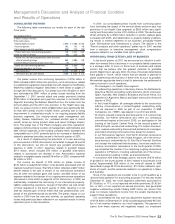
CONSOLIDATED OVERVIEW
The following table summarizes our results for each of the last
three years.
Years Ended December 31 2002 2001 2000
(In millions, except per share data)
Pretax income (loss):
Property-liability insurance $244 $(1,400) $1,467
Asset management 162 142 135
Parent company and other operations (230) (173) (201)
Pretax income (loss) from continuing operations 176 (1,431) 1,401
Income tax expense (benefit) (73) (422) 431
Income (loss) from continuing operations before cumulative
effect of accounting change 249 (1,009) 970
Cumulative effect of accounting change, net of taxes (6) ——
Income (loss) from continuing operations 243 (1,009) 970
Discontinued operations, net of taxes (25) (79) 23
Net income (loss) $218 $(1,088) $ 993
Net income (loss) per share (diluted) $0.92 $(5.22) $ 4.24
Our pretax income from continuing operations of $176 million in
2002 included a $472 million loss provision, net of reinsurance, related
to a settlement agreement we entered into with respect to the Western
MacArthur asbestos litigation (described in more detail on pages 27
through 28 of this discussion). Our pretax loss of $1.43 billion in 2001
was dominated by $941 million of pretax losses resulting from the
September 11, 2001 terrorist attack and pretax provisions totaling
$735 million to strengthen prior-year loss reserves in our Health Care
segment. Excluding the Western MacArthur loss, the losses from the
terrorist attack and the 2001 loss provision in the Health Care seg-
ment, our pretax income in 2002 of $648 million was significantly bet-
ter than 2001 pretax income of $245 million, primarily due to strong
improvement in underwriting results in our ongoing property-liability
business segments. Our majority-owned asset management sub-
sidiary, Nuveen Investments, Inc., achieved another year of record
results, driven by strong product sales and recent strategic acquisi-
tions. The pretax loss in the “Parent company and other operations”
category (which primarily consists of management, administrative and
debt service expenses at the holding company level) exceeded the
comparable loss in 2001 primarily due to an increase in distributions
related to preferred securities issued in the fourth quarter of 2001.
As a result of implementing the provisions of a new accounting
pronouncement in 2002 (discussed in more detail on pages 32 and 33
of this discussion), we did not record any goodwill amortization
expense in 2002. In 2001, expenses related to goodwill totaled
$114 million, which included $73 million of goodwill write-downs
related to businesses we decided to exit. Amortization expense
related to intangible assets totaled $18 million in 2002, compared with
$2 million in 2001.
Our income tax benefit of $73 million on pretax income of
$176 million included $124 million of tax benefits associated with net
realized investment losses. That $124 million reflected a $207 million
benefit related to the sale of certain of our international operations
and all other net realized gains and losses, and $83 million of tax
expense related to the transfer of our ongoing reinsurance operations
(discussed in more detail on page 24 of this discussion). In 2002, we
substantially completed the refocusing of our international property-
liability underwriting operations. As part of that effort, we sold certain
of those operations in the fourth quarter of 2002, resulting in a net
after-tax realized gain of $132 million that was predominantly com-
prised of the aforementioned tax benefits. The pretax impact on our
results in 2002 from the sale was nominal, as significant operating
losses had previously been reflected in our reported results for these
operations prior to their divestiture.
In 2001, our consolidated pretax income from continuing opera-
tions (excluding the impact of the terrorist attack and prior-year loss
provisions in our Health Care segment) of $245 million was signifi-
cantly less than pretax income of $1.4 billion in 2000.The decline was
driven primarily by a $726 million reduction in pretax realized gains
compared with 2000, and deterioration in property-liability underwrit-
ing results in several segments of our business, principally Health
Care, Reinsurance and International & Lloyd’s. The decline in the
“Parent company and other operations” pretax loss in 2001 resulted
from a reduction in executive management stock compensation
expense related to our variable stock option grants.
WITHDRAWAL FROM CERTAIN LINES OF BUSINESS
In the fourth quarter of 2001, we announced our intention to with-
draw from several lines of business in our property-liability operations
in a strategic effort to focus on those lines of business and market
sectors that we believe offer the greatest potential for profitable
growth. Beginning in January 2002, the lines of business listed below
were placed in “runoff,” which means that we ceased or planned to
cease underwriting new business in these lines as soon as possible.
We maintain appropriate levels of staff to administer the settlement of
claims incurred in runoff operations.
• All coverages in our Health Care segment.
• All underwriting operations in Germany, France, the Netherlands,
Argentina, Mexico (excluding surety business, which continues),
Spain, Australia, New Zealand, Botswana and South Africa. Our
operations in Argentina, Mexico and Spain were sold in the fourth
quarter of 2002.
• In the United Kingdom, all coverages offered to the construction
industry. (Unionamerica, a United Kingdom underwriting entity
that we acquired in 2000 as part of our acquisition of MMI
Companies, Inc. (“MMI”), was placed in runoff in late 2000).
• At Lloyd’s, casualty insurance and reinsurance, U.S.surplus lines
business, non-marine reinsurance and, when our contractual
commitment expires at the end of 2003, our participation in the
insuring of the Lloyd’s Central Fund. (In the second quarter of
2002 at Lloyd’s, we resumed underwriting U.S.surplus lines busi-
ness, ceased underwriting financial and professional coverages,
and exited remaining reinsurance lines except for aviation).
• In our Reinsurance segment, most North American reinsurance
business underwritten in the United Kingdom, all of the reinsur-
ance business underwritten by St. Paul Re’s Financial Solutions
unit (except the traditional finite business), bond and credit rein-
surance, and aviation reinsurance. In the fourth quarter of 2002,
we completed the transfer of our remaining ongoing reinsurance
operations to Platinum, including substantially all of the reinsur-
ance business incepting in 2002, as disclosed below.
In connection with these strategic actions, we wrote off $73 million
of goodwill in the fourth quarter of 2001 related to businesses to be
exited. Approximately $56 million of the write-off related to MMI
(described on page 28 of this discussion), $10 million related to oper-
ations at Lloyd’s, and the remainder related to our operations in Spain
and Australia.
None of the operations we consider to be in runoff qualifies as a
“discontinued operation” for accounting purposes. For the year ended
December 31, 2002, the runoff segments collectively accounted for
$1.16 billion, or 17%, of our reported net written premiums, $1.92 bil-
lion, or 26%, of our reported net earned premiums, and generated
negative underwriting results totaling $409 million (an amount that
does not include investment income from the assets maintained to
support these operations).
Our consolidated net loss and loss adjustment expense reserves
of $14.8 billion at December 31, 2002 included approximately $6.3 bil-
lion of net reserves related to our runoff segments. The payment of
claims from these reserves will negatively impact our investment
The St. Paul Companies 2002 Annual Report 23
Management’s Discussion and Analysis of Financial Condition
and Results of Operations