Travelers 2002 Annual Report Download - page 36
Download and view the complete annual report
Please find page 36 of the 2002 Travelers annual report below. You can navigate through the pages in the report by either clicking on the pages listed below, or by using the keyword search tool below to find specific information within the annual report.-
 1
1 -
2
-
3
-
4
-
5
-
6
-
7
-
8
-
9
-
10
-
11
-
12
-
13
-
14
-
15
-
16
-
17
-
18
-
19
-
20
-
21
-
22
-
23
-
24
-
25
-
 26
26 -
 27
27 -
 28
28 -
 29
29 -
 30
30 -
 31
31 -
 32
32 -
 33
33 -
 34
34 -
 35
35 -
 36
36 -
 37
37 -
 38
38 -
 39
39 -
 40
40 -
 41
41 -
 42
42 -
 43
43 -
 44
44 -
 45
45 -
 46
46 -
47
-
48
-
49
-
50
-
51
-
52
-
53
-
54
-
55
-
56
-
57
-
58
-
59
-
60
-
61
-
62
-
63
-
64
-
65
-
66
-
67
-
68
-
69
-
70
-
71
-
72
-
73
-
74
-
75
-
76
-
77
-
78
-
79
-
80
-
81
-
82
-
83
-
84
-
85
-
86
-
87
-
88
-
89
-
90
-
91
-
92
-
93
-
94
-
95
-
96
-
97
-
98
-
99
-
100
 |
 |

new business, and, to a lesser extent, in our Other segment, where
we increased our participation in several Lloyd’s syndicates.
UNDERWRITING RESULT
Underwriting result is a common measurement of a property-liabil-
ity insurer’s performance, representing premiums earned less losses
incurred and underwriting expenses. The statutory combined ratio,
representing the sum of the statutory loss and loss adjustment
expense ratio and the statutory expense ratio (described in more
detail on page 35 of this discussion), is also a common measure of
underwriting performance. The lower the ratio, the better the result.
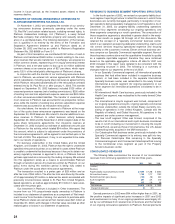
The following table presents a reconciliation of our ongoing and runoff
segments’ underwriting results to our reported underwriting results
for the last three years.
Years Ended December 31 2002 2001 2000
($ in millions)
ONGOING SEGMENTS:
Underwriting result $(300) $(308) $ 204
Loss and loss adjustment expense ratio 76.7 76.3 58.1
Underwriting expense ratio 27.8 29.5 34.5
Statutory combined ratio 104.5 105.8 92.6
RUNOFF SEGMENTS:
Underwriting result $(409) $(1,986) $ (513)
Loss and loss adjustment expense ratio 93.8 143.0 90.2
Underwriting expense ratio 34.0 25.9 35.3
Statutory combined ratio 127.8 168.9 125.5
CONSOLIDATED TOTAL:
Underwriting result $(709) $(2,294) $ (309)
Loss and loss adjustment expense ratio 81.1 102.5 70.0
Underwriting expense ratio 28.8 28.1 34.8
Statutory combined ratio 109.9 130.6 104.8
The underwriting result for our ongoing segments in 2002 was
dominated by the $472 million pretax loss recorded in our Commercial
Lines segment related to the Western MacArthur asbestos litigation
settlement. In 2001, ongoing segment results included $288 million of
losses from the September 11, 2001 terrorist attack and $26 million of
benefits from the reinsurance treaties described below. Excluding
these items in each year, the 2002 underwriting profit of $172 million
was a significant improvement over the 2001 loss of $46 million,
reflecting the benefit of strong price increases implemented over the
last two years and improvement in the quality of risks insured through-
out these segments.The nearly $2 billion of underwriting losses in our
runoff segments in 2001 were driven by the $735 million of prior-year
loss reserves in our Health Care segment, and $653 million of losses
related to the terrorist attack.
Reinsurance treaties. Underwriting results in 2001 and 2000 were
affected by our participation in separate aggregate excess-of-loss
reinsurance treaties that we entered into effective on January 1st of
each year (hereinafter referred to as the “corporate program”). In
2002, we were not party to such a treaty. Coverage under the corpo-
rate program treaties was triggered when our incurred insurance
losses and loss adjustment expenses spanning all segments of our
business exceeded accident year attachment loss ratios specified in
the treaty. In addition, our Reinsurance segment results were
impacted by a separate aggregate excess-of-loss reinsurance treaty
in each year, unrelated to the corporate program. All of these treaties
are collectively referred to herein as the “reinsurance treaties.”
Under the terms of the reinsurance treaties, we transferred, or
“ceded,” insurance losses and loss adjustment expenses to our rein-
surers, along with the related written and earned premiums. For the
corporate program, we paid the ceded earned premiums shortly after
coverage under the treaties was invoked, which negatively impacts
our investment income in future periods because we will not recover
the ceded losses and loss adjustment expenses from our reinsurer
until we settle the related claims, a process that may occur over sev-
eral years. For the separate Reinsurance segment treaties, we remit
the premiums ceded (plus accrued interest) to our counterparty when
the related losses and loss adjustment expenses are settled.
34
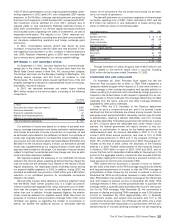
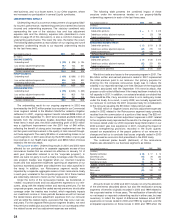
The following table presents the combined impact of these
cessions under the reinsurance treaties on our property-liability
underwriting segments in each of the last three years.
Years Ended December 31 2002 2001 2000
(In millions)
CORPORATE PROGRAM:
Ceded written premiums $— $9 $419
Ceded losses and loss adjustment expenses —(25) 709
Ceded earned premiums —9419
Net pretax benefit (detriment) —(34) 290
REINSURANCE SEGMENT TREATY:
Ceded written premiums $(1) $119 $ 55
Ceded losses and loss adjustment expenses (35) 278 122
Ceded earned premiums (1) 119 55
Net pretax benefit (detriment) (34) 159 67
COMBINED TOTAL:
Ceded written premiums $(1) $128 $ 474
Ceded losses and loss adjustment expenses (35) 253 831
Ceded earned premiums (1) 128 474
Net pretax benefit (detriment) $(34) $125 $ 357
We did not cede any losses to the corporate program in 2001.The
$9 million written and earned premiums ceded in 2001 represented
the initial premium paid to our reinsurer. Our primary purpose for
entering into the corporate reinsurance treaty was to reduce the
volatility in our reported earnings over time.Because of the magnitude
of losses associated with the September 11th terrorist attack, that
purpose could not be fulfilled even if the treaty had been invoked to its
full capacity in 2001. In addition, our actuarial analysis concluded that
there would be little, if any, economic value to us in ceding any losses
under the treaty. As a result, in early 2002, we mutually agreed with
our reinsurer to commute the 2001 corporate treaty for consideration
to the reinsurer equaling the $9 million initial premium paid.
The $35 million of negative losses and loss adjustment expenses
ceded in 2002 related to the Reinsurance segment treaty primarily
resulted from the commutation of a portion of that treaty. The $25 mil-
lion of negative losses and loss adjustment expenses in 2001 related
to the corporate treaty represented the results of a change in estimate
for losses ceded under our 2000 corporate treaty. Deterioration in our
2000 accident year loss experience in 2001, including the impact of
reserve strengthening provisions recorded in the fourth quarter,
caused our expectations of the payout patterns of our reinsurer to
change and led us to conclude that losses originally ceded in 2000
would exceed an economic limit prescribed in the 2000 treaty.
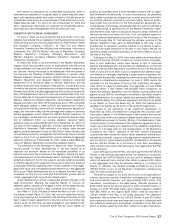
The combined pretax benefit (detriment) of the reinsurance
treaties was allocated to our business segments as follows.
Years Ended December 31 2002 2001 2000
(In millions)
Specialty Commercial $(9) $17 $ 74
Commercial Lines (10) 29 (28)
Surety & Construction (9) 15 45
International & Lloyd’s 12 (35) 96
Subtotal – ongoing segments (16) 26 187
Health Care 22 (1) 43
Reinsurance (40) 100 127
Other ———
Subtotal – runoff segments (18) 99 170
Total $(34) $125 $ 357
Amounts shown for 2002 and 2001 include not only the allocation
of the detriments described above, but also the reallocation among
segments of benefits originally recorded in 2000 and 1999 related to
the corporate treaties in those years. The reallocation of benefits had
no net impact on reported underwriting results in either year, but was
necessary to reflect the impact of differences between actual 2001
experience on losses ceded in 2000 and 1999, by segment, and the
anticipated experience on those losses in 2000 and 1999 when the