Travelers 2002 Annual Report Download - page 42
Download and view the complete annual report
Please find page 42 of the 2002 Travelers annual report below. You can navigate through the pages in the report by either clicking on the pages listed below, or by using the keyword search tool below to find specific information within the annual report.-
 1
1 -
2
-
3
-
4
-
5
-
6
-
7
-
8
-
9
-
10
-
11
-
12
-
13
-
14
-
15
-
16
-
17
-
18
-
19
-
20
-
21
-
22
-
23
-
24
-
25
-
26
-
27
-
28
-
29
-
30
-
31
-
 32
32 -
 33
33 -
 34
34 -
 35
35 -
 36
36 -
 37
37 -
 38
38 -
 39
39 -
 40
40 -
 41
41 -
 42
42 -
 43
43 -
 44
44 -
 45
45 -
 46
46 -
 47
47 -
 48
48 -
 49
49 -
 50
50 -
 51
51 -
 52
52 -
53
-
54
-
55
-
56
-
57
-
58
-
59
-
60
-
61
-
62
-
63
-
64
-
65
-
66
-
67
-
68
-
69
-
70
-
71
-
72
-
73
-
74
-
75
-
76
-
77
-
78
-
79
-
80
-
81
-
82
-
83
-
84
-
85
-
86
-
87
-
88
-
89
-
90
-
91
-
92
-
93
-
94
-
95
-
96
-
97
-
98
-
99
-
100
 |
 |

and new business throughout these operations. The 2001 total
included approximately $44 million of incremental premiums from the
elimination of the one-quarter reporting lag. Public Sector Services
coverages accounted for $83 million of 2002 international specialty
premium volume, and Financial and Professional Services coverages
accounted for $75 million of written premiums in 2002.
The $134 million improvement in underwriting results over 2001
was centered in our international specialties, which recorded an under-
writing profit of $24 million in 2002, compared with an underwriting loss
of $81 million in 2001. Price increases and the absence of significant
weather-related losses accounted for the improvement over 2001. Our
Lloyd’s operations recorded an underwriting profit of $2 million in 2002,
compared with a loss of $33 million in 2001. Results from all of our
lines of business at Lloyd’s benefited from significant price increases in
the wake of the September 11, 2001 terrorist attack, as well as from
the lack of significant catastrophe activity in 2002.
2001 vs.2000 — Premium growth in 2001 was primarily due to new
business resulting from increased capacity in our operations at Lloyd’s.
Our Lloyd’s premium volume of $247 million in 2001 grew 46% over
2000 volume of $168 million. In addition, price increases in our opera-
tions at Lloyd’s averaged nearly 20% for the year, and began to accel-
erate further after the September 11 terrorist attack.The elimination of
the one-quarter reporting lag for a portion of our international business
accounted for approximately $44 million of incremental premiums
in 2001. Price increases in the United Kingdom and Canada also
contributed to strong premium growth in those locations compared
with 2001.
The underwriting losses of $108 million in 2001 included $29 mil-
lion of additional losses from the elimination of the one-quarter report-
ing lag. At Lloyd’s in 2001, the underwriting loss of $33 million was
$13 million worse than in 2000, primarily due to an increase in catas-
trophe losses. That deterioration was substantially offset by slight
improvements in results in our international specialties.
PROPERTY-LIABILITY INSURANCE OPERATIONS
Health Care
The Health Care segment historically provided a wide range of
medical liability insurance products and services for health care
providers throughout the entire health care delivery system, including
individual physicians, physician groups, hospitals, managed care
organizations and long-term care facilities, as well as certain traditional
medical care coverages. In the fourth quarter of 2001, we announced
our intention to exit the medical liability insurance market, subject to
applicable regulatory requirements. Accordingly, this segment was
considered to be in runoff in 2002. In the fourth quarter of 2002, we
revised our segment reporting structure. The international business
previously included in this segment was reclassified to the “Other”
segment. All data presented for 2001 and 2000 was reclassified to be
consistent with the 2002 presentation.
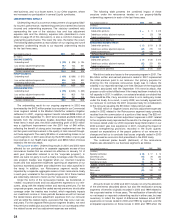
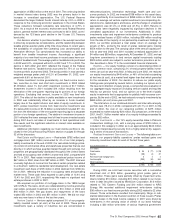
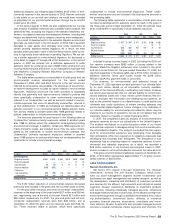
The following table summarizes key financial data for each of the
last three years in this segment. Data for all years exclude the impact
of the corporate reinsurance treaty, and data for 2002 and 2001
exclude the impact of the terrorist attack. Data including these factors
is presented on page 36 of this discussion.
Years Ended December 31 2002 2001 2000
($ in millions)
Written premiums $203 $666 $ 592
Percentage change from prior year (70)% 13%
Underwriting result $(187) $(928) $ (262)
Loss and loss adjustment expense ratio 120.1 208.5 118.0
Underwriting expense ratio 34.0 22.7 24.4
Combined ratio 154.1 231.2 142.4
2002 vs. 2001 — Written premiums in 2002 were generated by
extended reporting endorsements, and professional liability coverages
underwritten primarily in the first quarter of the year prior to our non-
renewal notifications becoming effective in several states. We are
required to offer reporting endorsements to claims-made policyholders
at the time their policies are not renewed.These endorsements cover
losses incurred in prior periods that have not yet been reported. Unlike
40
typical policies, premiums on these endorsements are fully earned,
and the expected losses are fully reserved, at the time the endorse-
ment is written.The majority of reporting endorsements underwritten in
2002 pertained to physicians’ and surgeons’ liability coverage. Our exit
from the Health Care market continues to proceed as planned when
we announced the action at the end of 2001. As of December 31,
2002, we had ceased underwriting business in jurisdictions represent-
ing 99% of written premiums in force at the end of 2001, and we had
obtained all necessary regulatory approvals in those jurisdictions.
The 2002 underwriting loss included $85 million in provisions to
increase net prior accident year loss reserves, comprised specifically
of a $97 million charge in the second quarter of the year, and reduc-
tions totaling $12 million throughout the year resulting primarily from
reinsurance contract commutations.The majority of remaining losses
in 2002 consisted of current-year losses related to reporting
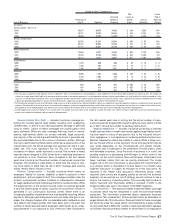
endorsements. Details regarding the $97 million prior-year loss pro-
vision recorded in the second quarter of 2002 are included in the fol-
lowing table.
Beginning Allocation
Accident Year Reserve of Charge
(In millions)
2001 $ 607 $100
2000 572 13
1999 480 (16)
1998 328 (1)
Prior 590 1
Total $ 2,577 $ 97
The significant allocation to the 2001 accident year is consistent
with the nature of the claims-made insurance product. The average
payment date on this book of reserves is approximately two years,
meaning that about 50% of the losses will be settled within two years.
Accordingly, any change in assumptions would be expected to signifi-
cantly impact the most recent accident years.
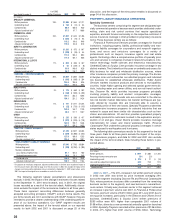
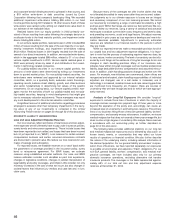
In the years ended December 31, 2001 and 2000, we recorded
cumulative provisions of $735 million and $225 million, respectively, to
strengthen prior accident year loss reserves in this segment. The fol-
lowing table presents a rollforward of loss activity for the Health Care
segment for the years ended December 31, 2002, 2001 and 2000.This
information includes loss amounts and claim data for the entire Health
Care segment, whereas tables presented elsewhere in this discussion
relate only to our medical malpractice line of business.
Years Ended December 31 2002 2001 2000
($ in millions)
Reserves for losses and allocated LAE at
beginning of period $2,577 $2,204 $2,297
Losses and allocated LAE incurred:
Reserve strengthening 85 735 225
Other incurred 494 672 587
Losses and allocated LAE paid (1,080) (1,034) (905)
Reserve for losses and allocated LAE at end of period $2,076 $2,577 $2,204
Number of claims paid during period 16,446 20,963 19,055
Number of claims pending at end of period 15,002 18,945 19,777
The following presents a summary of trends we observed within our
Health Care segment, by quarter, for the three-year period ended
December 31, 2002. The discussion focuses on our Medical
Malpractice line of business, since 99% of the reserve adjustments
related to this business. Our Medical Malpractice business includes all
medical liability coverage within our Health Care segment, and com-
prised approximately 91% of our total Health Care segment reserves at
December 31, 2002; the remaining business included in the segment is
represented by claims arising out of ancillary business (such as auto-
mobile and property coverage for our Medical Malpractice customers).
There were no offsetting increases or decreases in reserves of different
lines within our Health Care segment. Of the Medical Malpractice
reserve adjustments recorded in 2002, approximately 88% related to
2001 incurred losses; approximately 50% to 2000 incurred losses;
approximately (7)% to 1999 incurred losses; approximately 6% to 1998