Travelers 2002 Annual Report Download - page 63
Download and view the complete annual report
Please find page 63 of the 2002 Travelers annual report below. You can navigate through the pages in the report by either clicking on the pages listed below, or by using the keyword search tool below to find specific information within the annual report.-
 1
1 -
2
-
3
-
4
-
5
-
6
-
7
-
8
-
9
-
10
-
11
-
12
-
13
-
14
-
15
-
16
-
17
-
18
-
19
-
20
-
21
-
22
-
23
-
24
-
25
-
26
-
27
-
28
-
29
-
30
-
31
-
32
-
33
-
34
-
35
-
36
-
37
-
38
-
39
-
40
-
41
-
42
-
43
-
44
-
45
-
46
-
47
-
48
-
49
-
50
-
51
-
52
-
 53
53 -
 54
54 -
 55
55 -
 56
56 -
 57
57 -
 58
58 -
 59
59 -
 60
60 -
 61
61 -
 62
62 -
 63
63 -
 64
64 -
 65
65 -
 66
66 -
 67
67 -
 68
68 -
 69
69 -
 70
70 -
 71
71 -
 72
72 -
 73
73 -
74
-
75
-
76
-
77
-
78
-
79
-
80
-
81
-
82
-
83
-
84
-
85
-
86
-
87
-
88
-
89
-
90
-
91
-
92
-
93
-
94
-
95
-
96
-
97
-
98
-
99
-
100
 |
 |

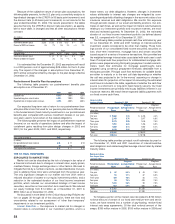
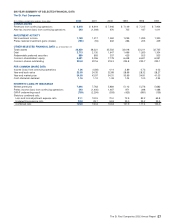
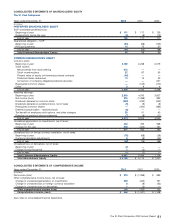
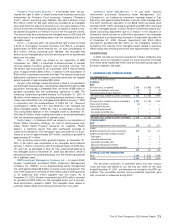
CONSOLIDATED STATEMENTS OF SHAREHOLDERS’ EQUITY
The St. Paul Companies
Years ended December 31 2002 2001 2000
(In millions)
PREFERRED SHAREHOLDERS’ EQUITY
SOP convertible preferred stock:
Beginning of year $111 $117 $ 129
Redemptions during the year (6) (6) (12)
End of year 105 111 117
Guaranteed obligation – SOP:
Beginning of year (53) (68) (105)
Principal payments 13 15 37
End of year (40) (53) (68)
Total Preferred Shareholders’ Equity 65 58 49
COMMON SHAREHOLDERS’ EQUITY
Common stock
Beginning of year 2,192 2,238 2,079
Stock issued:
Net proceeds from stock offering 413 ——
Stock incentive plans 32 67 95
Present value of equity unit forward purchase contracts (46) ——
Preferred shares redeemed 13 13 23
Conversion of company-obligated preferred securities ——207
Reacquired common shares —(135) (170)
Other 294
End of year 2,606 2,192 2,238
Retained earnings:
Beginning of year 2,500 4,243 3,827
Net income (loss) 218 (1,088) 993
Dividends declared on common stock (252) (235) (232)
Dividends declared on preferred stock, net of taxes (9) (9) (8)
Reacquired common shares —(454) (366)
Deferred compensation - restricted stock (5) ——
Tax benefit on employee stock options, and other changes 28 51 40
Premium on preferred shares redeemed (7) (8) (11)
End of year 2,473 2,500 4,243
Unrealized appreciation on investments, net of taxes:
Beginning of year 442 765 568
Change for the year 229 (323) 197
End of year 671 442 765
Unrealized loss on foreign currency translation, net of taxes:
Beginning of year (76) (68) (26)
Currency translation adjustments 8(8) (42)
End of year (68) (76) (68)
Unrealized loss on derivatives, net of taxes:
Beginning of year (2) ——
Change during the period 1(2) —
End of year (1) (2) —
Total Common Shareholders’ Equity 5,681 5,056 7,178
Total Shareholders’ Equity $5,746 $5,114 $ 7,227
CONSOLIDATED STATEMENTS OF COMPREHENSIVE INCOME
Years ended December 31 2002 2001 2000
(In millions)
Net income (loss) $218 $(1,088) $ 993
Other comprehensive income (loss), net of taxes:
Change in unrealized appreciation on investments 229 (323) 197
Change in unrealized loss on foreign currency translation 8(8) (42)
Change in unrealized loss on derivatives 1(2) —
Other comprehensive income (loss) 238 (333) 155
Comprehensive income (loss) $456 $(1,421) $ 1,148
See notes to consolidated financial statements.
The St. Paul Companies 2002 Annual Report 61