Travelers 2002 Annual Report Download - page 4
Download and view the complete annual report
Please find page 4 of the 2002 Travelers annual report below. You can navigate through the pages in the report by either clicking on the pages listed below, or by using the keyword search tool below to find specific information within the annual report.-
 1
1 -
 2
2 -
 3
3 -
 4
4 -
 5
5 -
 6
6 -
 7
7 -
 8
8 -
 9
9 -
 10
10 -
 11
11 -
 12
12 -
 13
13 -
 14
14 -
 15
15 -
16
-
17
-
18
-
19
-
20
-
21
-
22
-
23
-
24
-
25
-
26
-
27
-
28
-
29
-
30
-
31
-
32
-
33
-
34
-
35
-
36
-
37
-
38
-
39
-
40
-
41
-
42
-
43
-
44
-
45
-
46
-
47
-
48
-
49
-
50
-
51
-
52
-
53
-
54
-
55
-
56
-
57
-
58
-
59
-
60
-
61
-
62
-
63
-
64
-
65
-
66
-
67
-
68
-
69
-
70
-
71
-
72
-
73
-
74
-
75
-
76
-
77
-
78
-
79
-
80
-
81
-
82
-
83
-
84
-
85
-
86
-
87
-
88
-
89
-
90
-
91
-
92
-
93
-
94
-
95
-
96
-
97
-
98
-
99
-
100
 |
 |

2
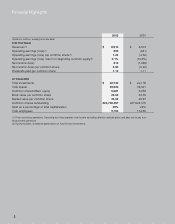
Financial Highlights
2002 2001
(Dollars in millions, except per share data)
FOR THE YEAR
Revenues(1) $8,918 $8,919
Operating earnings (loss)(1) 290 (941)
Operating earnings (loss) per common share(1) 1.24 (4.52)
Operating earnings (loss) return on beginning common equity(2) 6.1% (13.6%)
Net income (loss) 218 (1,088)
Net income (loss) per common share 0.92 (5.22)
Dividends paid per common share 1.15 1.11
AT YEAR END
Total investments $22,733 $22,178
Total assets 39,920 38,321
Common shareholders’ equity 5,681 5,056
Book value per common share 25.05 24.35
Market value per common share 34.05 43.97
Common shares outstanding 226,798,457 207,624,375
Debt as a percentage of total capitalization 29% 26%
Total employees 9,700 10,200
(1) From continuing operations. Operating earnings represent net income excluding after-tax realized gains and after-tax losses from
discontinued operations.
(2) Equity excludes unrealized appreciation on fixed income investments.