Travelers 2002 Annual Report Download - page 61
Download and view the complete annual report
Please find page 61 of the 2002 Travelers annual report below. You can navigate through the pages in the report by either clicking on the pages listed below, or by using the keyword search tool below to find specific information within the annual report.-
 1
1 -
2
-
3
-
4
-
5
-
6
-
7
-
8
-
9
-
10
-
11
-
12
-
13
-
14
-
15
-
16
-
17
-
18
-
19
-
20
-
21
-
22
-
23
-
24
-
25
-
26
-
27
-
28
-
29
-
30
-
31
-
32
-
33
-
34
-
35
-
36
-
37
-
38
-
39
-
40
-
41
-
42
-
43
-
44
-
45
-
46
-
47
-
48
-
49
-
50
-
 51
51 -
 52
52 -
 53
53 -
 54
54 -
 55
55 -
 56
56 -
 57
57 -
 58
58 -
 59
59 -
 60
60 -
 61
61 -
 62
62 -
 63
63 -
 64
64 -
 65
65 -
 66
66 -
 67
67 -
 68
68 -
 69
69 -
 70
70 -
 71
71 -
72
-
73
-
74
-
75
-
76
-
77
-
78
-
79
-
80
-
81
-
82
-
83
-
84
-
85
-
86
-
87
-
88
-
89
-
90
-
91
-
92
-
93
-
94
-
95
-
96
-
97
-
98
-
99
-
100
 |
 |

The St. Paul Companies 2002 Annual Report 59
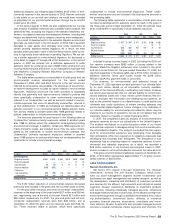
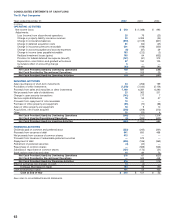
CONSOLIDATED STATEMENTS OF OPERATIONS
The St. Paul Companies
Years ended December 31 2002 2001 2000
(In millions, except per share data)
REVENUES
Premiums earned $7,390 $7,296 $ 5,592
Net investment income 1,169 1,217 1,262
Asset management 397 374 370
Realized investment gains (losses) (165) (94) 632
Other 127 126 90
Total revenues 8,918 8,919 7,946
EXPENSES
Insurance losses and loss adjustment expenses 5,995 7,479 3,913
Policy acquisition expenses 1,563 1,589 1,396
Operating and administrative expenses 1,184 1,282 1,236
Total expenses 8,742 10,350 6,545
Income (loss) from continuing operations before cumulative
effect of accounting change and income taxes 176 (1,431) 1,401
Income tax expense (benefit) (73) (422) 431
Income (loss) from continuing operations before cumulative
effect of accounting change 249 (1,009) 970
Cumulative effect of accounting change, net of taxes (6) ——
Income (loss) from continuing operations 243 (1,009) 970
Discontinued operations:
Operating income, net of taxes —19 43
Loss on disposal, net of taxes (25) (98) (20)
Gain (loss) from discontinued operations (25) (79) 23
Net Income (Loss) $218 $(1,088) $ 993
BASIC EARNINGS (LOSS) PER COMMON SHARE
Income (loss) from continuing operations before cumulative effect $1.09 $(4.84) $ 4.39
Cumulative effect of accounting change, net of taxes (0.03) ——
Gain (loss) from discontinued operations, net of taxes (0.12) (0.38) 0.11
Net Income (Loss) $0.94 $(5.22) $ 4.50
DILUTED EARNINGS (LOSS) PER COMMON SHARE
Income (loss) from continuing operations before cumulative effect $1.06 $(4.84) $ 4.14
Cumulative effect of accounting change, net of taxes (0.03) ——
Gain (loss) from discontinued operations, net of taxes (0.11) (0.38) 0.10
Net Income (Loss) $0.92 $(5.22) $ 4.24
See notes to consolidated financial statements.