Travelers 2002 Annual Report Download - page 37
Download and view the complete annual report
Please find page 37 of the 2002 Travelers annual report below. You can navigate through the pages in the report by either clicking on the pages listed below, or by using the keyword search tool below to find specific information within the annual report.-
 1
1 -
2
-
3
-
4
-
5
-
6
-
7
-
8
-
9
-
10
-
11
-
12
-
13
-
14
-
15
-
16
-
17
-
18
-
19
-
20
-
21
-
22
-
23
-
24
-
25
-
26
-
 27
27 -
 28
28 -
 29
29 -
 30
30 -
 31
31 -
 32
32 -
 33
33 -
 34
34 -
 35
35 -
 36
36 -
 37
37 -
 38
38 -
 39
39 -
 40
40 -
 41
41 -
 42
42 -
 43
43 -
 44
44 -
 45
45 -
 46
46 -
 47
47 -
48
-
49
-
50
-
51
-
52
-
53
-
54
-
55
-
56
-
57
-
58
-
59
-
60
-
61
-
62
-
63
-
64
-
65
-
66
-
67
-
68
-
69
-
70
-
71
-
72
-
73
-
74
-
75
-
76
-
77
-
78
-
79
-
80
-
81
-
82
-
83
-
84
-
85
-
86
-
87
-
88
-
89
-
90
-
91
-
92
-
93
-
94
-
95
-
96
-
97
-
98
-
99
-
100
 |
 |

initial segment allocation was made. All allocations shown for 2001
and 2000 have been reclassified among segments to be consistent
with our new segment reporting structure implemented in 2002.
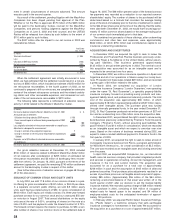
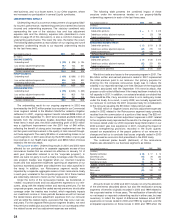
Loss Ratio — The loss ratio measures insurance losses and loss
adjustment expenses incurred as a percentage of earned premiums.
The following tabular presentation reconciles our reported loss ratio to
a loss ratio for our ongoing segments, which in turn is reconciled to an
adjusted ongoing segments’ loss ratio excluding several notable items
in each of the years ended December 31, 2002, 2001 and 2000. We
believe the tabular reconciliation provides a helpful depiction of the
impact of these items.
Years Ended December 31 2002 2001 2000
Reported loss ratio 81.1 102.5 70.0
Detriment attributable to runoff segments (4.4) (26.2) (11.9)
Ongoing segments loss ratio 76.7 76.3 58.1
Notable benefits (detriments) embedded
in ongoing segments loss ratio:
Western MacArthur settlement (8.6) ——
September 11, 2001 terrorist attack 0.8 (6.2) —
Other catastrophe losses (1.3) (1.0) (0.6)
Corporate reinsurance treaties (0.5) 1.1 8.1
Adjusted ongoing segments loss ratio 67.1 70.2 65.6
Catastrophe losses in 2002 totaled $67 million, of which $35 mil-
lion was recorded in our ongoing segments and $32 million in our
runoff segments. The primary sources of catastrophe losses in 2002
were several storms across the United States throughout the year.
Net catastrophe losses totaled $1.27 billion in 2001, of which
$1.11 billion was due to the September 11th terrorist attack. The
majority of the other $160 million of catastrophe losses were centered
in our runoff segments and were largely the result of a variety of
storms throughout the year in the United States and the explosion of
a chemical manufacturing plant in Toulouse, France. In 2000, catas-
trophe losses totaled $165 million, comprised primarily of additional
loss development arising from severe windstorms that struck portions
of Europe in late 1999, and severe flooding in the United Kingdom.
Since catastrophe losses are not recognized until an event occurs, the
occurrence of a catastrophic event can have a material impact on our
results of operations during the period incurred. Subsequent changes
to our estimate of catastrophic losses, based on better information,
can also materially impact our results of operations during that period.
The 3.1 point improvement in the 2002 adjusted ongoing seg-
ments loss ratio (as defined in the table above) over 2001 reflected
the impact of significant price increases over the last two years and
markedly improved current accident year results in our ongoing busi-
ness segments. The strong improvement in 2002 was achieved
despite $217 million of adverse prior-year loss development (account-
ing for 4.0 points of our adjusted ongoing segments’ loss ratio) in our
Surety & Construction segment, as discussed on pages 38 through
39 of this discussion. The 4.6-point deterioration in the 2001 adjusted
ongoing segments loss ratio (as defined in the table above) compared
with 2000 primarily resulted from reserve strengthening in our Surety
& Construction segment in response to weakening economic condi-
tions, and a reduction in favorable prior-year loss development in our
Commercial Lines segment.These factors are analyzed in more detail
in the individual segment discussions that follow.
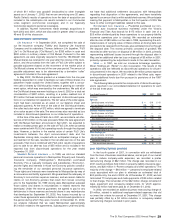
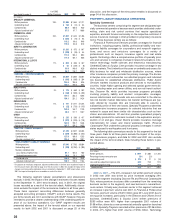
Expense Ratio — The expense ratio measures underwriting
expenses as a percentage of premiums written. The following tabular
presentation reconciles our reported expense ratio to an expense
ratio for our ongoing segments, which in turn is reconciled to an
adjusted ongoing segments’ expense ratio excluding several notable
items in each of the years ended December 31, 2002, 2001 and 2000.
We believe the tabular reconciliation provides a helpful depiction of
the impact of these items.
Years Ended December 31 2002 2001 2000
Reported expense ratio 28.8 28.1 34.8
Benefit (detriment) attributable to runoff segments (1.0) 1.4 (0.3)
Ongoing segments expense ratio 27.8 29.5 34.5
Notable benefits (detriments) embedded in ongoing
segments expense ratio:
Corporate reinsurance treaties 0.2 (0.4) (2.3)
September 11, 2001 terrorist attack —(0.3) —
Adjusted ongoing segments expense ratio 28.0 28.8 32.2
The 1.4 point benefit attributable to runoff segments in our
reported 2001 expense ratio primarily represented the impact of
reducing contingent commission expense by $91 million in our
Reinsurance segment.The commissions, which were payable contin-
gent on the loss experience on the reinsurance treaties to which they
related, had been accrued prior to September 11th; however, the
magnitude of our reinsurance losses from the terrorist attack resulted
in the reversal of that expense accrual.
No underwriting expenses were ceded under the reinsurance
treaties; however, our reported expense ratios in all three years
included effects of written premiums ceded (or, in the case of 2002,
reallocated to our ongoing segments) under the reinsurance treaties.
The improvement in our adjusted ongoing segments expense ratios in
2002 and 2001 (as defined in the table above) reflected the combined
effect of significant premium growth in both years, as well as efficien-
cies realized throughout our underwriting operations as a result of our
expense reduction initiatives over the last three years.The magnitude
of improvement in 2002 over 2001 was mitigated somewhat by the
impact of written premiums ceded for terrorism coverage.
Expense reduction efforts in recent years included the consolida-
tion of field office locations, the streamlining of our claim organization,
the restructuring of several of our business segments, and the com-
bined elimination of approximately 1,200 employee positions since
our strategic initiatives were announced in December 2001. As a
result of those and other expense management initiatives, we were
able to considerably reduce our controllable expenses in 2002.
UNDERWRITING RESULTS BY SEGMENT
The following table summarizes written premiums, underwriting
results and combined ratios for each of our property-liability under-
writing business segments for the last three years (underwriting
results are presented on a GAAP basis; combined ratios are pre-
sented on a statutory accounting basis). All data for 2001 and 2000
were reclassified to conform to our new segment reporting format
implemented in the fourth quarter of 2002. Following the table are
detailed analyses of our results by segment.
The St. Paul Companies 2002 Annual Report 35