Travelers 2002 Annual Report Download - page 38
Download and view the complete annual report
Please find page 38 of the 2002 Travelers annual report below. You can navigate through the pages in the report by either clicking on the pages listed below, or by using the keyword search tool below to find specific information within the annual report.
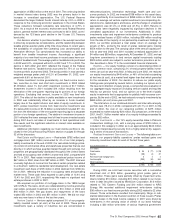
% of 2002
Years Ended December 31 Written Premiums 2002 2001 2000
($ in millions)
SPECIALTY COMMERCIAL
Written premiums 28% $1,986 $1,564 $1,211
Underwriting result $193 $(14) $ 64
Combined ratio 88.5 100.0 93.0
Adjusted combined ratio* 87.5 97.7 100.0
COMMERCIAL LINES
Written premiums 26% $1,827 $1,643 $1,456
Underwriting result $(331) $(16) $ 84
Combined ratio 118.2 99.6 94.0
Adjusted combined ratio* 119.5 92.8 91.9
SURETY & CONSTRUCTION
Written premiums 18% $1,266 $973 $ 847
Underwriting result $(222) $(39) $ 64
Combined ratio 117.8 103.4 89.2
Adjusted combined ratio* 117.2 104.7 95.6
INTERNATIONAL & LLOYD’S
Written premiums 11% $808 $656 $ 347
Underwriting result $60$(239) $ (8)
Combined ratio 90.9 140.0 92.8
Adjusted combined ratio* 95.7 118.7 122.7
SUBTOTAL – ONGOING SEGMENTS
Written premiums 83% $5,887 $4,836 $3,861
Underwriting result $(300) $(308) $ 204
Combined ratio 104.5 105.8 92.6
Adjusted combined ratio* 105.0 100.0 98.3
HEALTH CARE
Written premiums 3% $173 $660 $ 532
Underwriting result $(166) $(935) $ (220)
Combined ratio 157.0 233.2 139.6
Adjusted combined ratio* 154.1 231.2 142.4
REINSURANCE
Written premiums 11% $751 $1,677 $1,074
Underwriting result $(22) $(726) $ (115)
Combined ratio 102.8 145.7 112.0
Adjusted combined ratio* 96.9 117.7 120.7
OTHER
Written premiums 3% $235 $590 $ 417
Underwriting result $(221) $(325) $ (178)
Combined ratio 167.0 155.7 143.8
Adjusted combined ratio* 163.7 138.2 143.5
SUBTOTAL – RUNOFF SEGMENTS
Written premiums 17% $1,159 $2,927 $2,023
Underwriting result $(409) $(1,986) $ (513)
Combined ratio 127.8 168.9 125.5
Adjusted combined ratio* 124.4 150.9 130.7
TOTAL PROPERTY-LIABILITY INSURANCE
Written premiums 100% $7,046 $7,763 $5,884
Underwriting result $(709) $(2,294) $ (309)
Statutory combined ratio:
Loss and loss expense ratio 81.1 102.5 70.0
Underwriting expense ratio 28.8 28.1 34.8
Combined ratio 109.9 130.6 104.8
Adjusted combined ratio* 109.7 119.3 110.4
* For purposes of meaningful comparison, adjusted combined ratios in all three years exclude the impact of
the reinsurance treaties described on page 34 of this discussion. In 2002, they exclude the impact of the
changes in estimate and the reallocation of losses related to the September 11, 2001 terrorist attack, and in
2001, the impact of the original losses recorded as a result of the attack.
The following segment tabular presentations and discussions
exclude, in 2002, the impact of the change in estimate of losses related
to the September 11, 2001 terrorist attack, and, in 2001, the original
losses recorded as a result of the terrorist attack. Additionally, discus-
sions exclude the impact of the reinsurance treaties in all three years.
These items represent reconciling differences between generally
accepted accounting principles (“GAAP”) and pro forma results. The
pro forma results are not in accordance with GAAP; however, they are
intended to provide a clearer understanding of the underlying perform-
ance of our business operations. Our GAAP segment results are
presented above, the impact of the terrorist attack on our reported
results for both 2002 and 2001 is discussed on page 25 of this
36
discussion, and the impact of the reinsurance treaties is discussed on
page 34 of this discussion.
PROPERTY-LIABILITY INSURANCE OPERATIONS
Specialty Commercial
The business centers comprising this segment are designated spe-
cialty commercial operations because each provides dedicated under-
writing, claim and risk control services that require specialized
expertise, and each focuses exclusively on the respective customers it
serves. Insurance coverage is often provided on proprietary insurance
forms. Those business centers are as follows:
Financial & Professional Services provides coverages for financial
institutions, including property, liability, professional liability and man-
agement liability coverages for corporations and nonprofit organiza-
tions; and errors and omissions coverages for a variety of
professionals such as lawyers, insurance agents and real estate
agents. Technology offers a comprehensive portfolio of specialty prod-
ucts and services to companies involved in telecommunications, infor-
mation technology, health sciences and electronics manufacturing.
Umbrella/Excess & Surplus Lines provides insurance coverage in two
distinct markets.The Umbrella unit focuses on umbrella and excess lia-
bility business for retail and wholesale distribution sources, where
other insurance companies provide the primary coverage.The Excess
& Surplus Lines unit underwrites non-admitted program and individual
risk business for established wholesale distributors. Public Sector
Services markets insurance products and services to municipalities,
counties, Indian Nation gaming and selected special government dis-
tricts, including water and sewer utilities, and non-rail transit authori-
ties. Discover Re, which provides insurance programs principally
involving property, liability and workers’ compensation coverages,
serves retail brokers and insureds who are committed to the alterna-
tive risk transfer market. Alternative risk transfer techniques are typi-
cally utilized by insureds who are financially able to assume a
substantial portion of their own losses. Specialty Programs underwrites
comprehensive insurance programs for selected industries that are
national in scope and have similar risk characteristics such as fran-
chises and associations. Oil and Gas provides specialized property
and liability products for customers involved in the exploration and pro-
duction of oil and gas. Ocean Marine provides insurance coverage
internationally for ocean and inland waterways traffic. Personal
Catastrophe Risk underwrites personal property coverages in certain
states exposed to earthquakes and hurricanes.
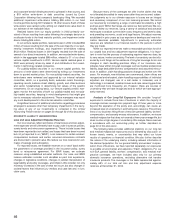
The following table summarizes results for this segment for the last
three years. Data for all three years exclude the impact of the corpo-
rate reinsurance program, and data for 2002 and 2001 also exclude
the impact of the terrorist attack. Data including these factors is pre-
sented above.
Years Ended December 31 2002 2001 2000
($ in millions)
Written premiums $1,971 $1,605 $ 1,318
Percentage increase over prior year 23% 22%
Underwriting result $210 $21$(10)
Loss and loss adjustment expense ratio 64.2 73.0 72.9
Underwriting expense ratio 23.3 24.7 27.1
Combined ratio 87.5 97.7 100.0
2002 vs. 2001 — The 23% increase in net written premium volume
in 2002 over 2001 was driven by price increases averaging 29%
across the segment (excluding Discover Re and Personal Catastrophe
Risk, whose premium structures differ somewhat from the remaining
business centers in the segment), and new business in several busi-
ness centers.Virtually every business center in this segment achieved
an increase in premium volume over 2001. In Financial & Professional
Services, premium volume of $410 million grew 23% over 2001 due to
strong price increases, particularly in the Directors and Officers line of
business. Umbrella/Excess & Surplus Lines’ written premiums of
$293 million were 48% higher than comparable 2001 volume of
$198 million, driven by a new commercial umbrella operation launched
in 2002.Specialty Programs recorded written premiums of $156 million
in 2002, 47% higher than 2001 volume of $106 million. Technology


