Travelers 2002 Annual Report Download - page 39
Download and view the complete annual report
Please find page 39 of the 2002 Travelers annual report below. You can navigate through the pages in the report by either clicking on the pages listed below, or by using the keyword search tool below to find specific information within the annual report.-
 1
1 -
2
-
3
-
4
-
5
-
6
-
7
-
8
-
9
-
10
-
11
-
12
-
13
-
14
-
15
-
16
-
17
-
18
-
19
-
20
-
21
-
22
-
23
-
24
-
25
-
26
-
27
-
28
-
 29
29 -
 30
30 -
 31
31 -
 32
32 -
 33
33 -
 34
34 -
 35
35 -
 36
36 -
 37
37 -
 38
38 -
 39
39 -
 40
40 -
 41
41 -
 42
42 -
 43
43 -
 44
44 -
 45
45 -
 46
46 -
 47
47 -
 48
48 -
 49
49 -
50
-
51
-
52
-
53
-
54
-
55
-
56
-
57
-
58
-
59
-
60
-
61
-
62
-
63
-
64
-
65
-
66
-
67
-
68
-
69
-
70
-
71
-
72
-
73
-
74
-
75
-
76
-
77
-
78
-
79
-
80
-
81
-
82
-
83
-
84
-
85
-
86
-
87
-
88
-
89
-
90
-
91
-
92
-
93
-
94
-
95
-
96
-
97
-
98
-
99
-
100
 |
 |

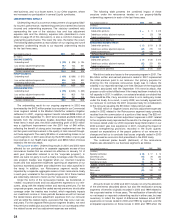
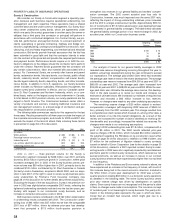
premiums of $374 million in 2002 were slightly below the 2001 total of
$379 million, reflecting the effects of the economic weakness in the
technology market sector.
The success of our underwriting and pricing actions throughout this
segment were reflected in the $189 million improvement in profitability
over 2001. Umbrella/Excess & Surplus Lines recorded a $51 million
improvement in underwriting results over 2001, driven by strong cur-
rent accident year results and a reduction in adverse prior year loss
development. Underwriting profits in Financial & Professional Services
in 2002 were $41 million higher than in 2001, and results in our
Specialty Programs business center improved by $34 million over
2001. All of our operations in the Specialty Commercial segment ben-
efited in 2002 from strong price increases and the relative lack of
catastrophe losses.
The 2002 segment-wide expense ratio improved by over a point
compared with 2001, reflecting the benefit of strong written premium
growth and the success of efficiency initiatives throughout this seg-
ment in recent years. Although we have added staff in response to
growing business volume throughout our Specialty Commercial seg-
ment, we have maintained tight controls over expense growth.
2001 vs. 2000 — Virtually all business centers played a role in the
22% growth in written premiums in 2001 over 2000, driven by price
increases and new business throughout the segment. The most
notable contributors to the increase were the Financial & Professional
Services, Public Sector Services, Technology and Oil & Gas business
centers.The Technology business center, which recorded a $44 million
underwriting profit in 2001, was a primary factor in the improvement in
GAAP underwriting results over 2000, due to significant improvement
in current year loss experience. Technology’s 2000 profit totaled
$23 million. Public Sector Services achieved a $20 million improve-
ment in underwriting results in 2001, driven by favorable prior year loss
experience. Ocean Marine also experienced strong improvement in
underwriting results in 2001, posting a $21 million profit due to favor-
able loss experience on both current and prior year business. The
improvements in these business centers were partially offset by an
increase in reinsurance costs in the Personal Catastrophe Risk busi-
ness center in 2001, where we made the strategic decision to cede a
larger portion of our business to limit our exposures.
PROPERTY-LIABILITY INSURANCE OPERATIONS
Commercial Lines
The Commercial Lines segment includes our Small Commercial,
Middle Market Commercial and Property Solutions business centers,
as well as the results of our limited involvement in insurance pools.The
Small Commercial business center services commercial firms that typ-
ically have between one and fifty employees through its proprietary
St. Paul MainstreetSM and St.Paul AdvantageSM products, with a partic-
ular focus on offices, wholesalers, retailers, artisan contractors and
other service risks. The Middle Market Commercial business center
offers comprehensive insurance coverages for a wide variety of
manufacturing, wholesale, service and retail exposures.This business
center also offers loss-sensitive casualty programs, including signifi-
cant deductible and self-insured retention options, for the higher end of
the middle market sector.The Property Solutions business center com-
bines our Large Accounts Property business with the commercial por-
tion of our catastrophe risk business and allows us to take a unified
approach to large property risks.
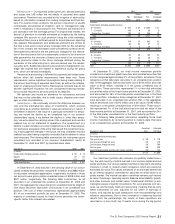
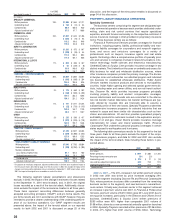
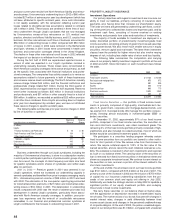
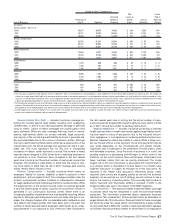
The following table summarizes key financial data for each of the
last three years in the Commercial Lines segment excluding the impact
of the terrorist attack in 2002 and 2001 and excluding the impact of the
corporate reinsurance program in all three years. Data including these
factors is presented on page 36 of this discussion.
Years Ended December 31 2002 2001 2000
($ in millions)
Written premiums $1,812 $1,724 $ 1,433
Percentage increase over prior year 5% 20%
Underwriting result $(350) $93 $112
Loss and loss adjustment expense ratio 89.2 63.1 57.8
Underwriting expense ratio 30.3 29.7 34.1
Combined ratio 119.5 92.8 91.9
2002 vs. 2001 — Although we implemented substantial price
increases in 2002, we experienced premium growth of only 5%. This
was primarily due to a decline in business retention levels resulting
from our concerted effort to increase profitability. We capitalized on
favorable market conditions in 2002 by implementing significant price
increases, rejecting new and renewal business where we could not
achieve appropriate price increases, and selectively adding new busi-
ness that met our pricing and underwriting criteria. Price increases
across the entire segment averaged 23% in 2002. Middle Market
Commercial net written premiums totaled $1.08 billion in 2002, 5%
higher than 2001 premiums of $1.04 billion. Our focus in 2002 was to
maximize the quality and profitability of our middle market book of busi-
ness; as a result, the impact of significant rate increases was substan-
tially offset by reductions in business retention rates and new business
levels. Small Commercial premium volume of $622 million in 2002
grew 7% over 2001 premiums of $579 million. We greatly expanded
our involvement in the small commercial marketplace in 2002 through
the development of products to serve particular sectors of the market,
and through investments in technology to enable easy access to those
products by agents, brokers and insureds.
Reported underwriting results in this segment in 2002 were domi-
nated by the $472 million net pretax loss provision related to the set-
tlement of the Western MacArthur asbestos litigation, described in
more detail on pages 27 through 28 of this discussion. Excluding that
impact, the Commercial Lines segment underwriting profit in 2002 was
$122 million. In 2001, reported results included the benefit of a
$128 million reduction in prior-year loss reserves, of which $93 million
related to certain business written prior to 1988. Excluding that bene-
fit, the 2001 result was an underwriting loss of $35 million. The signifi-
cant improvement in underwriting results from 2001 to 2002 (after
excluding the impact of the specified factors) reflected the impact of
price increases and the improvement in the quality of our book of busi-
ness, as well as a decline in catastrophe losses. Current accident-year
results in 2002 in all three business centers in this segment improved
over 2001, with the most notable improvement occurring in Middle
Market Commercial.
The slight increase in the expense ratio in 2002 reflected the impact
of premiums ceded for terrorism insurance coverage, which increased
the commission component of the expense ratio. In addition, our
investment in developing our small commercial business platform in
2002 substantially offset cost savings realized through our efficiency
initiatives in this segment.
2001 vs. 2000 — Premium growth in 2001 was driven by price
increases, strong renewal retention rates and new business through-
out the segment. Middle Market Commercial premiums totaled
$1.04 billion in 2001, 15% higher than 2000 premiums of $900 million.
In the Small Commercial business center, premium volume of
$579 million grew 19% over the comparable 2000 total of $485 million.
In July 2001, we established a new service center in Atlanta, which
contributed to premium growth in our Small Commercial operation by
providing agents and brokers in the southeastern U.S.with a more effi-
cient and cost-effective platform for placing small commercial business
with us.
The decline in the 2001 reported underwriting profit compared with
2000 was driven by a reduction in the magnitude of favorable prior-year
development in 2001.Current accident year results in all business cen-
ters in 2001 improved over 2000. Results in 2001 benefited from the
$128 million reduction in prior-year loss reserves. In 2000, prior-year
reserve reductions of approximately $260 million included $80 million
for various general liability reserves, $69 million for workers’ compen-
sation reserves and $50 million for certain business written prior to
1988. The significant improvement in the expense ratio in 2001
reflected the combined impact of significant premium growth and a
reduction in expenses.
The St. Paul Companies 2002 Annual Report 37