Travelers 2002 Annual Report Download - page 47
Download and view the complete annual report
Please find page 47 of the 2002 Travelers annual report below. You can navigate through the pages in the report by either clicking on the pages listed below, or by using the keyword search tool below to find specific information within the annual report.-
 1
1 -
2
-
3
-
4
-
5
-
6
-
7
-
8
-
9
-
10
-
11
-
12
-
13
-
14
-
15
-
16
-
17
-
18
-
19
-
20
-
21
-
22
-
23
-
24
-
25
-
26
-
27
-
28
-
29
-
30
-
31
-
32
-
33
-
34
-
35
-
36
-
 37
37 -
 38
38 -
 39
39 -
 40
40 -
 41
41 -
 42
42 -
 43
43 -
 44
44 -
 45
45 -
 46
46 -
 47
47 -
 48
48 -
 49
49 -
 50
50 -
 51
51 -
 52
52 -
 53
53 -
 54
54 -
 55
55 -
 56
56 -
 57
57 -
58
-
59
-
60
-
61
-
62
-
63
-
64
-
65
-
66
-
67
-
68
-
69
-
70
-
71
-
72
-
73
-
74
-
75
-
76
-
77
-
78
-
79
-
80
-
81
-
82
-
83
-
84
-
85
-
86
-
87
-
88
-
89
-
90
-
91
-
92
-
93
-
94
-
95
-
96
-
97
-
98
-
99
-
100
 |
 |

appreciation of $563 million at the end of 2001.The continuing decline
in market interest rates during 2002 was the primary factor in the
increase in unrealized appreciation. The U.S. Federal Reserve
decreased the target Federal Funds interest rate by 0.5% in 2002 in
response to the continuing economic weakness in the United States.
These reductions followed cumulative rate reductions of 4.75% in
2001. As a result of the economic environment and Federal Reserve
actions, general market interest rates continued to fall in 2002, as evi-
denced by the 123 basis point decline in the 10-year U.S. Treasury
bond yield.
Our decision whether to purchase taxable or tax-exempt securities
is driven by corporate tax considerations, and the relationship between
taxable and tax-exempt yields at the time of purchase. In recent years,
the availability of corporate Net Operating Loss carryforwards and
Alternative Minimum Tax carryforwards has increased our ability to
benefit from taxable investment income. Accordingly, a significant
majority of our new fixed income purchases in recent years have con-
sisted of taxable bonds.The average yield on taxable bonds purchased
in 2002 was 5.3%, compared with 6.5% in 2001 and 7.7% in 2000.The
decline in both 2002 and 2001 reflected the impact of the Federal
Reserve rate actions. Taxable bonds accounted for 75% of our fixed
income portfolio at year-end 2002.The bond portfolio in total carried a
weighted average pretax yield of 6.2% at December 31, 2002, com-
pared with 6.6% at the end of 2001.
Pretax investment income generated by our fixed income securi-
ties, securities on loan and short-term investments in 2002 totaled
$1.09 billion, down 1% from 2001 investment income of $1.11 billion.
Investment income in 2001 included $14 million resulting from the
elimination of the one-quarter reporting lag for portions of our foreign
operations. Excluding that amount, income in 2002 was level with
2001. The effect of the decline in yields available on new investments
in 2002 was substantially offset by an increase in funds invested,
largely due to the capital infusion and sales of equity investments. In
2001, pretax investment income from fixed income investments was
5% below 2000 income of $1.16 billion (a total which included $11 mil-
lion from the elimination of the one-quarter reporting lag for a separate
portion of our foreign operations). The decline in investment income in
2001 reflected the lower average level of fixed income invested assets
during 2001 due to net sales of investments to fund operational cash
flow needs, and the significant reduction in interest rates available on
new investments.
Additional information regarding our fixed income portfolio is dis-
closed in the Critical Accounting Policies section on pages 30 through
32 of this discussion.
Real Estate and Mortgage Loans — Real estate ($792 million) and
mortgage loans ($81 million) accounted for 4% of our total property-
liability investments at the end of 2002. Our real estate holdings prima-
rily consist of commercial office and warehouse properties that we own
directly or in which we have a partial interest through joint ventures. Our
properties are geographically distributed throughout the United States
and had an occupancy rate of 89.9% at year-end 2002, compared with
94.7% in 2001. Real estate investments produced pretax income of
$67 million in 2002, down from $97 million in 2001.The 2001 total was
unusually high due to income from the sale of certain properties related
to a Southern California residential land development. Our real estate
investment cash flows of $105 million in 2002 declined from $138 mil-
lion in 2001, reflecting the reduction in occupancy rates and prevailing
market rents. These cash flows equated to cash yields of 10.4% and
13.4% for 2002 and 2001, respectively. We made no significant real
estate purchases in 2002 or 2001.
We acquired our portfolio of mortgage loans in the 1998 merger
with USF&G. The loans, which are collateralized by income-producing
real estate, produced investment income of $10 million in 2002 and
$18 million in 2001. Net pay downs and repayments of the loans
totaled $52 million in 2002 and $51 million in 2001. We did not origi-
nate any new loans in either of the last two years.
Venture Capital — Venture capital comprised 3% of our property-
liability invested assets (at cost) at the end of 2002. These private
investments span a variety of industries but are concentrated in
telecommunications, information technology, health care and con-
sumer products. In 2002, we invested $138 million in this asset class,
down significantly from investments of $289 million in 2001. Our total
return on average net venture capital investments (encompassing div-
idend income, realized gains and losses, and the change in unrealized
appreciation) was (41.0%) in 2002 and (41.5%) in 2001. Returns in
both years were negatively impacted by significant declines in the
unrealized appreciation of our investments. Additionally in 2002,
investments sales and impairment write-downs combined to produce
pretax realized losses of $200 million, including $56 million resulting
from the sale of the majority of our partnership investment holdings. In
2000, our portfolio produced a total pretax return on average net
assets of 52%, primarily the result of pretax realized gains totaling
$554 million for the year. The carrying value of the venture capital port-
folio at year-end 2002 and 2001 included unrealized appreciation of
$4 million and $93 million, respectively. At December 31, 2002, we had
long-term commitments to fund venture capital investments totaling
$920 million which are subject to certain termination provisions as fur-
ther described in Note 17 to the consolidated financial statements.
Equities — Our equity holdings consist of a diversified portfolio of
public common stock, comprising 2% of total property-liability invest-
ments (at cost) at year-end 2002. In May and June 2002, we reduced
our equity investments by $445 million, or 46% of the total outstanding
at the time (at cost), at a market level higher than that which prevailed
for the remainder of 2002. Our decision to reduce our public equity
holdings was prompted by several factors, including our opinion as to
the near-term direction of equity prices, a comprehensive evaluation of
our aggregate equity exposure (including venture capital and equities
held by our pension fund), and our opinion as to the level of public
equity investments that is appropriate for publicly held insurance com-
panies. By the end of 2002, we had reduced our equity investments by
$683 million (at cost) since year-end 2001.
The total return on our combined domestic and international equity
portfolio was (19.4%) in 2002, compared with (20.7%) in 2001. At the
end of 2002, the cost of our remaining portfolio of $375 million
exceeded its market value by $20 million. By comparison, at the end of
2001, the $1.1 billion market value of our equity holdings exceeded its
cost by $52 million.
Other Investments — Our 14% equity ownership stake in Platinum
Underwriters Holdings, Ltd., with a carrying value of $129 million, is
included in this category in 2002, as is an approximately $400 million
long-term interest-bearing security from a highly-rated entity, support-
ing a series of insurance transactions.
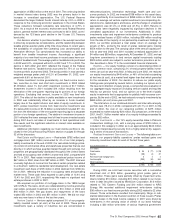
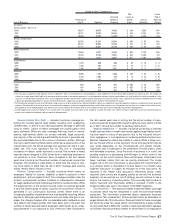
Realized Investment Gains and Losses — The following table sum-
marizes our property-liability operations’ pretax realized gains and
losses by investment class for each of the last three years.
Years Ended December 31 2002 2001 2000
($ in millions)
Fixed income $94 $(77) $ (29)
Equities (58) (4) 87
Real estate and mortgage loans 244
Venture capital (200) (43) 554
Other investments —(6) 8
Total $(162) $(126) $ 624
During 2002, we sold fixed income securities with a cumulative
amortized cost of $2.5 billion, generating gross pretax gains of
$185 million. These gains were partially offset by impairment write-
downs totaling $74 million, including $15 million related to our invest-
ment in debt securities issued by WorldCom Corporation, $13 million
related to TXU Eastern Funding and $10 million related to NRG
Energy. We recorded additional impairment write-downs totaling
$36 million in our fixed income portfolio during 2002 related to 22 other
issuers. Those write-downs resulted from bankruptcy filings or sub-
stantial deterioration in the financial condition of those issuers. Pretax
realized losses in the fixed income category in 2001 were driven by
write-downs in the carrying value of certain of our bond holdings,
including a $20 million write-down of various Argentina government
The St. Paul Companies 2002 Annual Report 45