Travelers 2002 Annual Report Download - page 55
Download and view the complete annual report
Please find page 55 of the 2002 Travelers annual report below. You can navigate through the pages in the report by either clicking on the pages listed below, or by using the keyword search tool below to find specific information within the annual report.-
 1
1 -
2
-
3
-
4
-
5
-
6
-
7
-
8
-
9
-
10
-
11
-
12
-
13
-
14
-
15
-
16
-
17
-
18
-
19
-
20
-
21
-
22
-
23
-
24
-
25
-
26
-
27
-
28
-
29
-
30
-
31
-
32
-
33
-
34
-
35
-
36
-
37
-
38
-
39
-
40
-
41
-
42
-
43
-
44
-
 45
45 -
 46
46 -
 47
47 -
 48
48 -
 49
49 -
 50
50 -
 51
51 -
 52
52 -
 53
53 -
 54
54 -
 55
55 -
 56
56 -
 57
57 -
 58
58 -
 59
59 -
 60
60 -
 61
61 -
 62
62 -
 63
63 -
 64
64 -
 65
65 -
66
-
67
-
68
-
69
-
70
-
71
-
72
-
73
-
74
-
75
-
76
-
77
-
78
-
79
-
80
-
81
-
82
-
83
-
84
-
85
-
86
-
87
-
88
-
89
-
90
-
91
-
92
-
93
-
94
-
95
-
96
-
97
-
98
-
99
-
100
 |
 |

THE ST. PAUL COMPANIES
Pension Plans
Due to the long-term nature of obligations under our pension
plans, the accounting for such plans is complex and reflects various
actuarial assumptions. Management’s selection of plan assumptions,
primarily the discount rate used to calculate the projected benefit obli-
gation and the expected long-term rate of return on plan assets
(“LTROR”), can have a significant impact on our resulting estimated
projected benefit obligation and pension cost, and thus on our consol-
idated results of operations. Such plan assumptions are determined
annually, subject to revision if significant events occur during the year,
such as plan mergers and significant plan amendments.
Our pension plan measurement date for purposes of our consoli-
dated financial statements is December 31. The market-related value
of plan assets is determined based on their fair value at the measure-
ment date. The projected benefit obligation is determined based on
the present value of projected benefit distributions at an assumed dis-
count rate.The discount rate used reflects the rate at which we believe
the pension plan obligations could be effectively settled at the meas-
urement date, as though the pension benefits of all plan participants
were determined as of that date. At December 31, 2002 and 2001, the
discount rates used to calculate our projected benefit obligation were
6.50% and 7.00%, respectively, for our consolidated pension plans
(encompassing our U.S. plan, our Canada plan, our U.K. plans and
Nuveen Investments’ plan). For our U.S. plan, which constitutes 93%
of our consolidated pension plan assets, such rates were determined
based on the Moody’s Investor Services AA Long-Term Industrial
December Average Bond yield with a duration of approximately 11 to
13 years (which correlates to the expected duration of our pension
obligations), rounded up to the nearest quarter percent.
Total pension cost encompasses the cost of service, interest costs
based on an assumed discount rate, an expected long-term rate of
return on plan assets and amortization of actuarial gains and losses,
adjusted for curtailment gains or losses, if any. Actuarial gains and
losses include the impact of unrecognized gains and losses that are
deferred and amortized over the expected future service period of
active employees. Any unrecognized gains or losses related to
changes in the amount of the projected benefit obligation or plan
assets resulting from experience that differs from the expected
returns and from changes in assumptions are deferred. To the extent
an unrecognized gain or loss exceeds 10 percent of the greater of the
projected benefit obligation or the fair value of plan assets (“10 per-
cent corridor”), the excess is recognized over the expected future
service periods of active employees.At December 31, 2002, the accu-
mulated unrecognized loss for our consolidated pension plans subject
to minimum amortization approximated $364 million, which exceeded
the 10 percent corridor, and will be amortized over 11 years. As a
result, pension cost in 2003 is expected to include approximately
$33 million of amortization. The amount of the unrecognized gain or
loss that is less than the 10% corridor, and is therefore not subject to
minimum amortization in 2003, was approximately $104 million at
December 31, 2002.
The expected long-term rate of return on plan assets is estimated
based on the plan’s actual historical return results, the expected allo-
cation of plan assets by investment class, market conditions and other
relevant factors. We evaluate only whether the actual allocation has
fallen within an expected range, and we then evaluate actual asset
returns in total, rather than by asset class, giving consideration to the
fact that our equity investments have a higher volatility than our other
investment classes, which is consistent with the market in general.
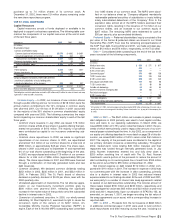
The following table presents the actual allocation of plan assets, in
comparison with the expected allocation range, both expressed as a
percentage of total plan assets, as of December 31 for our U.S. plan
only, which comprised 93% of our consolidated pension plan assets.
December 31 2002 2001
Asset Class Actual Expected Actual Expected
Cash* 22% 0 – 10% 3% 0 – 10%
Fixed maturities 31% 30 – 70% 34% 20 – 60%
Equities 45% 30 – 70% 61% 40 – 80%
Other 2% 0 – 10% 2% 0 – 10%
Total 100% 100%
*The high level of cash at year-end 2002 resulted from a significant contribution we made to the plan in
December.
The following table presents our consolidated pension plan
assumptions.
December 31 2002 2001 2000
Discount rate 6.50% 7.00% 6.75%
Expected long-term rate of return 8.50% 10.00% 10.00%
Expected rate of compensation increase 4.00% 4.00% 4.00%
At December 31, 2000, our discount rate assumption was deter-
mined based on a weighted average of the rates expected to be used
to settle our obligations, considering the portion of our obligation
expected to be settled by annuity payments and the portion expected
to be settled by lump sum payments. At December 31, 2001, consid-
ering the impact of the plan design change to add a cash balance for-
mula, we determined that the vast majority of the participants electing
to remain under the traditional pension formula would select the annu-
ity payment option.As such, we determined our projected benefit obli-
gation was more appropriately calculated using strictly the rate at
which we believed we could settle the annuity obligations. Based on
our assumption that the vast majority of the participants electing to
remain under the traditional pension formula would select the annuity
payment option, we eliminated from our discount rate determination
the lower rate that we assume would otherwise be used to settle lump
sum payments, and thereby increased our discount rate as of
December 31, 2001. In 2002, the declining interest rate environment
caused us to reduce our discount rate and LTROR as of
December 31, 2002.
As discussed above, investment and funding decisions and pen-
sion plan assumptions can materially impact our consolidated finan-
cial results of operations. Consequently, our Investment Benefit
Committee regularly evaluates investment returns, asset allocation
strategies, possible plan contributions, and plan assumptions.
Regardless of the extent of our analysis of such factors, plan assump-
tions reflect judgments and are subject to changes in economic fac-
tors.There can be no assurance that our assumptions will prove to be
correct or that they will not be subject to significant adjustments over
time. For purposes of comparison, for the six-year period and 20-year
period ended December 31, 2002 and 2001, our arithmetic average
actual returns on our U.S. plan assets were 7.71% and 12.48%,
respectively, for 2002 and 10.89% and 14.55%, respectively, for 2001.
Funding decisions are made based on a number of factors, including
the minimum regulatory funding requirements, the maximum tax-
deductible contributions, the estimated market value of plan assets in
relation to our accumulated benefit obligation, current market condi-
tions and other business factors. During 2002, we made contributions
to the U.S. plan and the United Kingdom plans of approximately
$149 million and $9 million, respectively, that were primarily necessi-
tated by the significant decline in market value of equity investments
held by the plans, which was consistent with general market trends
during 2002.
The following table presents the impact of consolidated net pen-
sion cost (income) on our results of operations (before and after the
impact of a curtailment loss resulting from plan design changes in
2001) for the years 2002, 2001, and 2000, respectively.
(In millions) 2002 2001 2000
Net periodic pension cost (income) $17 $(20) $ (41)
Curtailment loss 917 —
Net impact after curtailment loss $26 $(3) $ (41)
The St. Paul Companies 2002 Annual Report 53