PNC Bank 2000 Annual Report Download - page 94
Download and view the complete annual report
Please find page 94 of the 2000 PNC Bank annual report below. You can navigate through the pages in the report by either clicking on the pages listed below, or by using the keyword search tool below to find specific information within the annual report.-
 1
1 -
2
-
3
-
4
-
5
-
6
-
7
-
8
-
9
-
10
-
11
-
12
-
13
-
14
-
15
-
16
-
17
-
18
-
19
-
20
-
21
-
22
-
23
-
24
-
25
-
26
-
27
-
28
-
29
-
30
-
31
-
32
-
33
-
34
-
35
-
36
-
37
-
38
-
39
-
40
-
41
-
42
-
43
-
44
-
45
-
46
-
47
-
48
-
49
-
50
-
51
-
52
-
53
-
54
-
55
-
56
-
57
-
58
-
59
-
60
-
61
-
62
-
63
-
64
-
65
-
66
-
67
-
68
-
69
-
70
-
71
-
72
-
73
-
74
-
75
-
76
-
77
-
78
-
79
-
80
-
81
-
82
-
83
-
 84
84 -
 85
85 -
 86
86 -
 87
87 -
 88
88 -
 89
89 -
 90
90 -
 91
91 -
 92
92 -
 93
93 -
 94
94 -
 95
95 -
 96
96
 |
 |

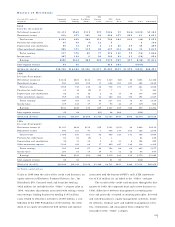
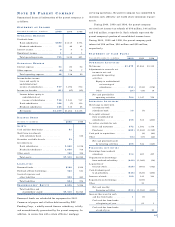
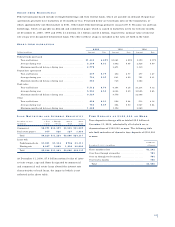
TI M E DE P O S I T S O F $ 1 0 0 , 0 0 0 O R MO R E
Time deposits in foreign offices totaled $2.2 billion at
December 31, 2000, substantially all of which are in
denominations of $100,000 or more. The following table
sets forth maturities of domestic time deposits of $100,000
or more:
Certificates
December 31, 2000 – in millions of Deposit
Three months or less . . . . . . . . . . . . . . . . . . . . . . . $1,202
Over three through six months . . . . . . . . . . . . . . . . 783
Over six through twelve months . . . . . . . . . . . . . . . 785
Over twelve months . . . . . . . . . . . . . . . . . . . . . . . . 786
Total . . . . . . . . . . . . . . . . . . . . . . . . . . . . . . . . . $3,5 56
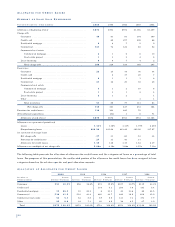
LO A N MA T U R I T I E S A N D IN T E R E S T SE N S I T I V I T Y
December 31, 2000 1 Year 1 Through After 5 Gross
In millions or Less 5 Years Years Loans
C o m m e r c i a l . . . . . . . . . $ 8 , 2 7 1 $ 1 0 , 3 9 7 $ 2 , 5 3 9 $ 2 1 , 2 0 7
Real estate pro j e c t . . . . 9 5 7 8 2 6 1 2 7 1 , 9 1 0
To t a l . . . . . . . . . . . . $ 9 , 2 2 8 $ 1 1 , 2 2 3 $ 2 , 6 6 6 $ 2 3 , 1 1 7
Loans with
P r e d e t e rmined rate . $ 1 , 0 2 1 $ 1 , 3 5 4 $ 7 3 6 $ 3 , 1 1 1
Floating rate . . . . . . 8 , 2 0 7 9 , 8 6 9 1 , 9 3 0 2 0 , 0 0 6
To t a l . . . . . . . . . . . . $ 9 , 2 2 8 $ 1 1 , 2 2 3 $ 2 , 6 6 6 $ 2 3 , 1 1 7
At December 31, 2000, $7.0 billion notional value of inter-
est rate swaps, caps and floors designated to commercial
and commercial real estate loans altered the interest rate
characteristics of such loans, the impact of which is not
reflected in the above table.
91
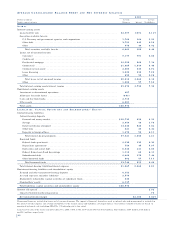
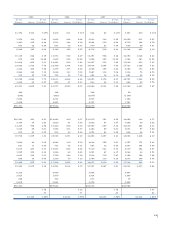
SH O R T -T E R M BO R R O W I N G S
Federal funds purchased include overnight borrowings and term federal funds, which are payable on demand. Repurchase
agreements generally have maturities of 18 months or less. Presented below are total bank notes of the Corporation, of
which approximately one-third mature in 2001. Other short-term borrowings primarily consist of U.S. Treasury, tax and loan
borrowings, which are payable on demand and commercial paper, which is issued in maturities not to exceed nine months.
At December 31, 2000, 1999 and 1998, $3.4 billion, $3.1 billion and $3.4 billion, respectively, notional value of interest
rate swaps were designated to borrowed funds. The effect of these swaps is included in the rates set forth in the table.
SH O R T -T E R M B O R R O W I N G S
2000 1999 1998
Dollars in millions Amount Rate Amount Rate Amount Rate
Federal funds purchased
Year-end balance . . . . . . . . . . . . . . . . . . . . . . . . . . . . . . . . $1,445 4.89% $1,281 4.05% $390 5.17%
Average during year . . . . . . . . . . . . . . . . . . . . . . . . . . . . . . 2,139 6.31 1,662 5.05 2,526 5.50
Maximum month-end balance during year . . . . . . . . . . . . . . 2,778 2,671 3,139
Repurchase agreements
Year-end balance . . . . . . . . . . . . . . . . . . . . . . . . . . . . . . . . 607 5.77 402 4.77 477 3.47
Average during year . . . . . . . . . . . . . . . . . . . . . . . . . . . . . . 754 5.97 621 4.99 791 5.31
Maximum month-end balance during year . . . . . . . . . . . . . . 864 725 1,682
Bank notes
Year-end balance . . . . . . . . . . . . . . . . . . . . . . . . . . . . . . . . 5,512 6.74 6,354 6.25 10,234 5.32
Average during year . . . . . . . . . . . . . . . . . . . . . . . . . . . . . . 5,934 6.55 8,224 5.29 10,505 5.65
Maximum month-end balance during year . . . . . . . . . . . . . . 6,527 9,775 12,008
Other
Year-end balance . . . . . . . . . . . . . . . . . . . . . . . . . . . . . . . . 632 6.31 956 5.64 513 4.16
Average during year . . . . . . . . . . . . . . . . . . . . . . . . . . . . . . 784 6.87 654 6.00 1,047 5.84
Maximum month-end balance during year . . . . . . . . . . . . . . 1,368 1,192 2,069