PNC Bank 2000 Annual Report Download - page 41
Download and view the complete annual report
Please find page 41 of the 2000 PNC Bank annual report below. You can navigate through the pages in the report by either clicking on the pages listed below, or by using the keyword search tool below to find specific information within the annual report.-
 1
1 -
2
-
3
-
4
-
5
-
6
-
7
-
8
-
9
-
10
-
11
-
12
-
13
-
14
-
15
-
16
-
17
-
18
-
19
-
20
-
21
-
22
-
23
-
24
-
25
-
26
-
27
-
28
-
29
-
30
-
 31
31 -
 32
32 -
 33
33 -
 34
34 -
 35
35 -
 36
36 -
 37
37 -
 38
38 -
 39
39 -
 40
40 -
 41
41 -
 42
42 -
 43
43 -
 44
44 -
 45
45 -
 46
46 -
 47
47 -
 48
48 -
 49
49 -
 50
50 -
 51
51 -
52
-
53
-
54
-
55
-
56
-
57
-
58
-
59
-
60
-
61
-
62
-
63
-
64
-
65
-
66
-
67
-
68
-
69
-
70
-
71
-
72
-
73
-
74
-
75
-
76
-
77
-
78
-
79
-
80
-
81
-
82
-
83
-
84
-
85
-
86
-
87
-
88
-
89
-
90
-
91
-
92
-
93
-
94
-
95
-
96
 |
 |

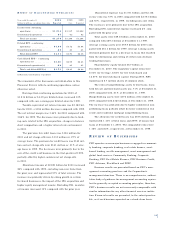
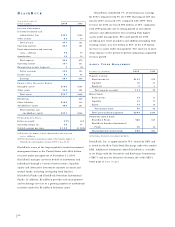
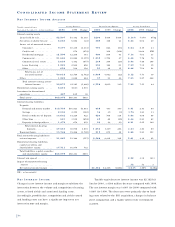
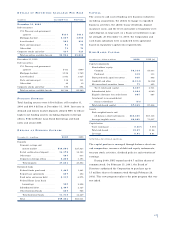
CO R P O R AT E BA N K I N G
Year ended December 31
Dollars in millions 2000 1999
IN C O M E ST A T E M E N T
Credit-related revenue . . . . . . . . . . . $406 $372
Noncredit revenue . . . . . . . . . . . . . . 433 373
Total revenue . . . . . . . . . . . . . . . 839 745
Provision for credit losses . . . . . . . . 79 16
Noninterest expense . . . . . . . . . . . . 384 360
Pretax earnings . . . . . . . . . . . . . . 376 369
Income taxes . . . . . . . . . . . . . . . . . . 132 123
Earnings . . . . . . . . . . . . . . . . . . . $244 $246
AV E R A G E BA L A N C E SH E E T
Loans
Middle market . . . . . . . . . . . . . . . $5,866 $5,655
Specialized industries . . . . . . . . . 3,780 3,975
Large corporate . . . . . . . . . . . . . . 2,564 2,276
Leasing . . . . . . . . . . . . . . . . . . . . 1,844 1,340
Other . . . . . . . . . . . . . . . . . . . . . 254 454
Total loans . . . . . . . . . . . . . . . . 14,308 13,700
Other assets . . . . . . . . . . . . . . . . . . 2,074 1,887
Total assets . . . . . . . . . . . . . . . . . $16,382 $15,587
Deposits . . . . . . . . . . . . . . . . . . . . . $4,701 $4,499
Assigned funds and other liabilities . 10,452 9,919
Assigned capital . . . . . . . . . . . . . . . 1,229 1,169
Total funds . . . . . . . . . . . . . . . . . $16,382 $15,587
PE R F O R M A N C E RA T I O S
Return on assigned capital . . . . . . . 20% 21%
N o n c r edit revenue to total re v e n u e . . 52 50
Efficiency . . . . . . . . . . . . . . . . . . . . 45 48
Corporate Banking provides credit, equipment leasing,
treasury management and capital markets products and
services to large and mid-sized corporations, institutions and
government entities primarily within PNC’s geographic
region.
The strategic focus for Corporate Banking is to empha-
size higher-margin noncredit products and services, espe-
cially treasury management and capital markets. Lending
activities are focused primarily within PNC’s geographic
region with consideration given to risk/return characteristics
and are a complement to sales of noncredit products and
services. Loans are syndicated to meet the credit needs of
larger borrowers and to reduce and diversify credit exposure.
Approximately 40% of the total loan portfolio at
December 31, 2000 was the result of syndications.
Corporate Banking made the decision to exit certain
non-strategic lending businesses during 1999. These
activities are excluded from business results in both periods
presented. Management continues to evaluate opportunities
to reduce lending exposure and improve the risk/return
characteristics of this business, including the downsizing of
certain specialized industry portfolios.
Corporate Banking contributed 19% of total business
earnings for 2000 compared with 21% for 1999. Earnings of
$244 million for 2000 were comparable with earnings of
$246 million for 1999.
Total revenue of $839 million for 2000 increased
$94 million or 13% compared with the prior year. Average
loans and credit-related revenue increased in the period-to-
period comparison primarily driven by loans to middle mar-
ket and large corporate customers that utilize higher-margin
noncredit products and services and the expansion of equip-
ment leasing. Noncredit revenue includes noninterest
income and the benefit of compensating balances received
in lieu of fees. Noncredit revenue increased $60 million or
16% compared with 1999 primarily driven by increases in
treasury management and capital markets fees and income
associated with equity investments. Noncredit revenue
comprised 52% of total revenue for 2000 compared with
50% last year, reflecting the emphasis on sales of
fee-based products.
The provision for credit losses was $79 million for
2000 compared with $16 million for 1999. The higher pro-
vision reflected an increase in net charge-offs associated
with the impact of a slowing economy primarily on the spe-
cialized industry portfolios. The provision for credit losses
for 2001 could increase further if the economy continues to
deteriorate or asset quality otherwise declines. See Credit
Risk in the Risk Management section of this Financial
Review for additional information regarding credit risk.
The increase in noninterest expense in the period-to-
period comparison was associated with growth in noncredit
products and services.
Treasury management and capital markets products
offered through Corporate Banking are sold by several busi-
nesses across the Corporation and related profitability is
included in the results of those businesses. Consolidated
revenue from treasury management was $341 million for
2000, an 11% increase compared with 1999. Consolidated
revenue from capital markets was $133 million for 2000, a
21% increase compared with 1999.
38