PNC Bank 2000 Annual Report Download - page 84
Download and view the complete annual report
Please find page 84 of the 2000 PNC Bank annual report below. You can navigate through the pages in the report by either clicking on the pages listed below, or by using the keyword search tool below to find specific information within the annual report.-
 1
1 -
2
-
3
-
4
-
5
-
6
-
7
-
8
-
9
-
10
-
11
-
12
-
13
-
14
-
15
-
16
-
17
-
18
-
19
-
20
-
21
-
22
-
23
-
24
-
25
-
26
-
27
-
28
-
29
-
30
-
31
-
32
-
33
-
34
-
35
-
36
-
37
-
38
-
39
-
40
-
41
-
42
-
43
-
44
-
45
-
46
-
47
-
48
-
49
-
50
-
51
-
52
-
53
-
54
-
55
-
56
-
57
-
58
-
59
-
60
-
61
-
62
-
63
-
64
-
65
-
66
-
67
-
68
-
69
-
70
-
71
-
72
-
73
-
 74
74 -
 75
75 -
 76
76 -
 77
77 -
 78
78 -
 79
79 -
 80
80 -
 81
81 -
 82
82 -
 83
83 -
 84
84 -
 85
85 -
 86
86 -
 87
87 -
 88
88 -
 89
89 -
 90
90 -
 91
91 -
 92
92 -
 93
93 -
 94
94 -
95
-
96
 |
 |

81
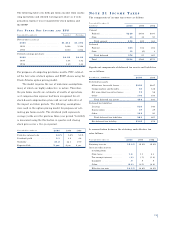
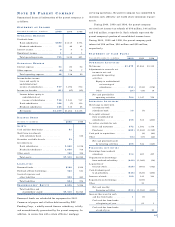
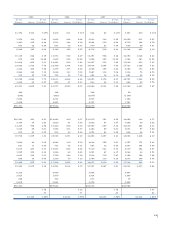
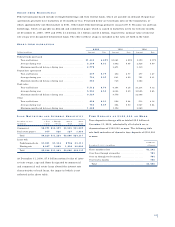
RE S U LT S O F BU S I N E S S E S
PNC PNC
Year ended December 31 Community Corporate Real Estate Business PNC Black-
In millions Banking Banking Finance Credit Advisors Rock PFPC Other Consolidated
2000
IN C O M E ST A T E M E N T
Net interest income (a) . . . . . . . . $1,414 $562 $115 $99 $136 $7 $(46) $(105) $2,182
Noninterest income . . . . . . . . . . . 619 277 105 20 656 477 656 81 2,891
Total revenue . . . . . . . . . . . . . . 2,033 839 220 119 792 484 610 (24) 5,073
Provision for credit losses . . . . . . 45 79 (7) 12 5 2 136
Depreciation and amortization . . . 85 13 20 2 14 20 49 56 259
Other noninterest expense . . . . . . 986 371 119 28 497 314 483 14 2,812
Pretax earnings . . . . . . . . . . . . 917 376 88 77 276 150 78 (96) 1,866
Income taxes . . . . . . . . . . . . . . . . 327 132 6 28 103 63 31 (38) 652
Earnings . . . . . . . . . . . . . . . . . $590 $244 $82 $49 $173 $87 $47 $(58) $1,214
Inter-segment revenue . . . . . . . . . $3 $5 $13 $84 $(105)
AV E R A G E AS S E T S . . . . . . . . $38,958 $16,382 $5,506 $2,271 $3,500 $537 $1,578 $(241) $68,491
1999
IN C O M E ST AT E M E N T
Net interest income (a) . . . . . . . . $1,418 $481 $112 $71 $130 $(8) $6 $156 $2,366
Noninterest income . . . . . . . . . . . 550 264 100 11 608 381 251 285 2,450
Total revenue . . . . . . . . . . . . . . 1,968 745 212 82 738 373 257 441 4,816
Provision for credit losses . . . . . . 61 16 (5) 11 7 73 163
Depreciation and amortization . . . 88 14 20 2 14 18 10 130 296
Other noninterest expense . . . . . . 969 346 106 23 480 252 175 196 2,547
Pretax earnings . . . . . . . . . . . . 850 369 91 46 237 103 72 42 1,810
Income taxes . . . . . . . . . . . . . . . . 307 123 17 17 90 44 27 (17) 608
Earnings . . . . . . . . . . . . . . . . . $543 $246 $74 $29 $147 $59 $45 $59 $1,202
Inter-segment revenue . . . . . . . . . $5 $2 $(1) $8 $84 $(98)
AV E R A G E AS S E T S . . . . . . . . . $37,502 $15,587 $5,554 $1,759 $3,353 $448 $308 $3,403 $67,914
1998
IN C O M E ST AT E M E N T
Net interest income (a) . . . . . . . . $1,391 $416 $114 $55 $121 $(11) $8 $420 $2,514
Noninterest income . . . . . . . . . . . 605 211 47 7 368 339 183 326 2,086
Total revenue . . . . . . . . . . . . . . 1,996 627 161 62 489 328 191 746 4,600
Provision for credit losses . . . . . . 81 84 (5) 3 1 61 225
Depreciation and amortization . . . 98 13 15 2 6 13 6 106 259
Other noninterest expense . . . . . . 1,036 306 84 17 290 247 125 334 2,439
Pretax earnings . . . . . . . . . . . . 781 224 67 40 192 68 60 245 1,677
Income taxes . . . . . . . . . . . . . . . . 293 81 15 15 73 32 22 66 597
Earnings . . . . . . . . . . . . . . . . . $488 $143 $52 $25 $119 $36 $38 $179 $1,080
Inter-segment revenue . . . . . . . . . $6 $1 $1 $6 $(14)
AV E R A G E AS S E T S . . . . . . . . . . $36,942 $14,329 $5,306 $1,380 $2,731 $441 $229 $7,918 $69,276
(a) Taxable-equivalent basis
Gains in 1999 from the sales of the credit card business, an
equity interest in Electronic Payment Services, Inc., the
BlackRock IPO, Concord stock and branches totaling
$422 million are included in the “Other” category. Also in
1999, valuation adjustments associated with exiting certain
non-strategic lending businesses totaling $195 million,
costs related to efficiency initiatives of $98 million, a con-
tribution to the PNC Foundation of $30 million, the write-
down of an equity investment of $28 million and expense
associated with the buyout of PNC’s mall ATM representa-
tive of $12 million are included in the “ Other” category.
The results of the credit card business through the first
quarter of 1999, the corporate trust and escrow business in
1998, differences between management accounting prac-
tices and generally accepted accounting principles, divested
and exited businesses, equity management activities, minor-
ity interests, residual asset and liability management activi-
ties, eliminations and unassigned items comprise the
remainder of the “Other” category.