PNC Bank 2000 Annual Report Download - page 40
Download and view the complete annual report
Please find page 40 of the 2000 PNC Bank annual report below. You can navigate through the pages in the report by either clicking on the pages listed below, or by using the keyword search tool below to find specific information within the annual report.-
 1
1 -
2
-
3
-
4
-
5
-
6
-
7
-
8
-
9
-
10
-
11
-
12
-
13
-
14
-
15
-
16
-
17
-
18
-
19
-
20
-
21
-
22
-
23
-
24
-
25
-
26
-
27
-
28
-
29
-
 30
30 -
 31
31 -
 32
32 -
 33
33 -
 34
34 -
 35
35 -
 36
36 -
 37
37 -
 38
38 -
 39
39 -
 40
40 -
 41
41 -
 42
42 -
 43
43 -
 44
44 -
 45
45 -
 46
46 -
 47
47 -
 48
48 -
 49
49 -
 50
50 -
51
-
52
-
53
-
54
-
55
-
56
-
57
-
58
-
59
-
60
-
61
-
62
-
63
-
64
-
65
-
66
-
67
-
68
-
69
-
70
-
71
-
72
-
73
-
74
-
75
-
76
-
77
-
78
-
79
-
80
-
81
-
82
-
83
-
84
-
85
-
86
-
87
-
88
-
89
-
90
-
91
-
92
-
93
-
94
-
95
-
96
 |
 |

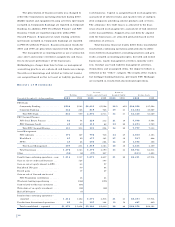
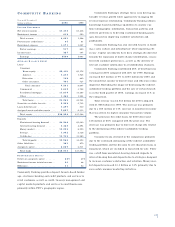
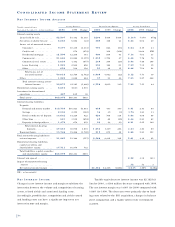
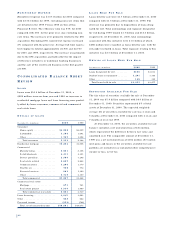
CO M M U N I T Y BA N K I N G
Year ended December 31
Dollars in millions 2000 1999
IN C O M E ST A T E M E N T
Net interest income . . . . . . . . . . . . . $1,414 $1,418
Noninterest income . . . . . . . . . . . . . 619 550
Total revenue . . . . . . . . . . . . . . . 2,033 1,968
Provision for credit losses . . . . . . . . 45 61
Noninterest expense . . . . . . . . . . . . 1,071 1,057
Pretax earnings . . . . . . . . . . . . . . 917 850
Income taxes . . . . . . . . . . . . . . . . . . 327 307
Earnings . . . . . . . . . . . . . . . . . . . $590 $543
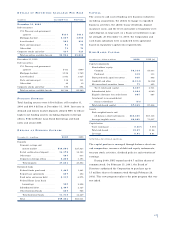
AV E R A G E BA L A N C E SH E E T
Loans
Consumer
Home equity . . . . . . . . . . . . . . $5,419 $5,176
Indirect . . . . . . . . . . . . . . . . . . 1,215 1,945
Education . . . . . . . . . . . . . . . . 102 849
Other consumer . . . . . . . . . . . . 795 727
Total consumer . . . . . . . . . . 7,531 8,697
Commercial . . . . . . . . . . . . . . . . . 3,649 3,708
Residential mortgage . . . . . . . . . . 11,619 11,285
Other . . . . . . . . . . . . . . . . . . . . . 1,466 1,254
Total loans . . . . . . . . . . . . . . . . 24,265 24,944
Securities available for sale . . . . . . . 5,539 5,735
Loans held for sale . . . . . . . . . . . . . 1,297 510
Assigned assets and other assets . . . 7,857 6,313
Total assets . . . . . . . . . . . . . . . . . $38,958 $37,502
Deposits
Noninterest-bearing demand . . . . $4,548 $5,000
Interest-bearing demand . . . . . . . 5,428 4,894
Money market . . . . . . . . . . . . . . . 10,253 8,990
Savings . . . . . . . . . . . . . . . . . . . . 1,992 2,328
Certificates . . . . . . . . . . . . . . . . . 13,745 13,280
Total deposits . . . . . . . . . . . . . 35,966 34,492
Other liabilities . . . . . . . . . . . . . . . . 363 479
Assigned capital . . . . . . . . . . . . . . . 2,629 2,531
Total funds . . . . . . . . . . . . . . . . . $38,958 $37,502
PE R F O R M A N C E RA T I O S
Return on assigned capital . . . . . . . 22% 21%
N o n i n t e rest income to total re v e n u e . . 30 28
Efficiency . . . . . . . . . . . . . . . . . . . . 51 52
Community Banking provides deposit, branch-based broker-
age, electronic banking and credit products and services to
retail customers as well as credit, treasury management and
capital markets products and services to small businesses
primarily within PNC’s geographic region.
Community Banking’s strategic focus is on driving sus-
tainable revenue growth while aggressively managing the
revenue/expense relationship. Community Banking utilizes
knowledge-based marketing capabilities to analyze cus-
tomer demographic information, transaction patterns and
delivery preferences to develop customized banking pack-
ages focused on improving customer satisfaction and
profitability.
Community Banking has also invested heavily in build-
ing a sales culture and infrastructure while improving effi-
ciency. Capital investments have been strategically directed
towards the expansion of multi-channel distribution, consis-
tent with customer preferences, as well as the delivery of
relevant customer information to all distribution channels.
Community Banking contributed 46% of total business
earnings for 2000 compared with 48% for 1999. Earnings
increased $47 million or 9% to $590 million for 2000 and
the noninterest income to total revenue and efficiency ratios
improved. Excluding the impact of downsizing the indirect
automobile lending portfolio and the sale of certain branch-
es in the third quarter of 1999, earnings increased 11% in
the comparison.
Total revenue was $2.033 billion for 2000 compared
with $1.968 billion for 1999. The increase was primarily
due to a $69 million or 13% increase in noninterest income
that was driven by higher consumer transaction volume.
The provision for credit losses for 2000 decreased
$16 million or 26% compared with the prior year. The
decrease was primarily due to lower net charge-offs related
to the downsizing of the indirect automobile lending
portfolio.
Consumer loans declined in the comparison primarily
due to the continued downsizing of the indirect automobile
lending portfolio and the decision to sell education loans in
repayment, which are included in loans held for sale. There
was a shift from noninterest-bearing demand deposits to
interest-bearing demand deposits due to strategies designed
to increase customer satisfaction and retention. Money mar-
ket deposits increased $1.3 billion or 14% primarily due to
successful consumer marketing initiatives.
37