PNC Bank 2000 Annual Report Download - page 36
Download and view the complete annual report
Please find page 36 of the 2000 PNC Bank annual report below. You can navigate through the pages in the report by either clicking on the pages listed below, or by using the keyword search tool below to find specific information within the annual report.-
 1
1 -
2
-
3
-
4
-
5
-
6
-
7
-
8
-
9
-
10
-
11
-
12
-
13
-
14
-
15
-
16
-
17
-
18
-
19
-
20
-
21
-
22
-
23
-
24
-
25
-
 26
26 -
 27
27 -
 28
28 -
 29
29 -
 30
30 -
 31
31 -
 32
32 -
 33
33 -
 34
34 -
 35
35 -
 36
36 -
 37
37 -
 38
38 -
 39
39 -
 40
40 -
 41
41 -
 42
42 -
 43
43 -
 44
44 -
 45
45 -
 46
46 -
47
-
48
-
49
-
50
-
51
-
52
-
53
-
54
-
55
-
56
-
57
-
58
-
59
-
60
-
61
-
62
-
63
-
64
-
65
-
66
-
67
-
68
-
69
-
70
-
71
-
72
-
73
-
74
-
75
-
76
-
77
-
78
-
79
-
80
-
81
-
82
-
83
-
84
-
85
-
86
-
87
-
88
-
89
-
90
-
91
-
92
-
93
-
94
-
95
-
96
 |
 |

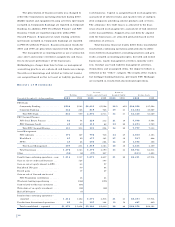
FI N A N C I A L RE V I E W
The PNC Financial Services Group, Inc.
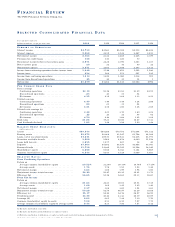
SE L E C T E D CO N S O L I D AT E D FI N A N C I A L DATA
Year ended December 31
Dollars in millions, except per share data 2000 1999 1998 1997 1996
SU M M A R Y O F OP E R AT I O N S
Interest income . . . . . . . . . . . . . . . . . . . . . . . . . . . . . $4,732 $4,583 $5,024 $4,912 $4,812
Interest expense . . . . . . . . . . . . . . . . . . . . . . . . . . . . 2,568 2,239 2,536 2,467 2,413
Net interest income . . . . . . . . . . . . . . . . . . . . . . . . . 2,164 2,344 2,488 2,445 2,399
Provision for credit losses . . . . . . . . . . . . . . . . . . . . . 136 163 225 70
Noninterest income before net securities gains . . . . . . 2,871 2,428 2,070 1,583 1,217
Net securities gains . . . . . . . . . . . . . . . . . . . . . . . . . . 20 22 16 40 22
Noninterest expense . . . . . . . . . . . . . . . . . . . . . . . . . 3,071 2,843 2,698 2,403 2,112
Income from continuing operations before income taxes . 1,848 1,788 1,651 1,595 1,526
Income taxes . . . . . . . . . . . . . . . . . . . . . . . . . . . . . . . 634 586 571 557 535
Income from continuing operations . . . . . . . . . . . . . . 1,214 1,202 1,080 1,038 991
Income from discontinued operations . . . . . . . . . . . . . 65 62 35 14 1
Net income . . . . . . . . . . . . . . . . . . . . . . . . . . . . . . . . $1,279 $1,264 $1,115 $1,052 $992
PE R CO M M O N SH A R E DAT A
Basic earnings
Continuing operations . . . . . . . . . . . . . . . . . . . . . . $4.12 $3.98 $3.53 $3.29 $2.91
Discontinued operations . . . . . . . . . . . . . . . . . . . . .23 .21 .11 .04
Net income . . . . . . . . . . . . . . . . . . . . . . . . . . . . . . 4.35 4.19 3.64 3.33 2.91
Diluted earnings
Continuing operations . . . . . . . . . . . . . . . . . . . . . . 4.09 3.94 3.49 3.24 2.88
Discontinued operations . . . . . . . . . . . . . . . . . . . . .22 .21 .11 .04
Net income . . . . . . . . . . . . . . . . . . . . . . . . . . . . . . 4.31 4.15 3.60 3.28 2.88
Diluted cash earnings (a)
Continuing operations . . . . . . . . . . . . . . . . . . . . . . 4.48 4.21 3.70 3.40 3.02
Discontinued operations . . . . . . . . . . . . . . . . . . . . .22 .21 .12 .05 .02
Net income . . . . . . . . . . . . . . . . . . . . . . . . . . . . . . 4.70 4.42 3.82 3.45 3.04
Book value . . . . . . . . . . . . . . . . . . . . . . . . . . . . . . . . 21.88 19.23 18.86 16.87 17.13
Cash dividends declared . . . . . . . . . . . . . . . . . . . . . . 1.83 1.68 1.58 1.50 1.42
BA L A N C E SH E E T HI G H L I G H T S
(at December 31) . . . . . . . . . . . . . . . . . . . . . . . . . . . . .
Assets . . . . . . . . . . . . . . . . . . . . . . . . . . . . . . . . . . . $69,844 $69,286 $70,754 $71,694 $71,312
Earning assets . . . . . . . . . . . . . . . . . . . . . . . . . . . . . 59,373 60,268 63,547 63,798 64,028
Loans, net of unearned income . . . . . . . . . . . . . . . . . 50,601 49,673 57,633 54,235 51,791
Securities available for sale . . . . . . . . . . . . . . . . . . . . 5,902 5,960 4,472 8,040 11,512
Loans held for sale . . . . . . . . . . . . . . . . . . . . . . . . . . . 1,655 3,477 467 18 40
Deposits . . . . . . . . . . . . . . . . . . . . . . . . . . . . . . . . . . 47,664 45,802 46,150 46,956 45,043
Borrowed funds . . . . . . . . . . . . . . . . . . . . . . . . . . . . . 11,718 14,229 15,939 16,958 18,345
Shareholders’ equity . . . . . . . . . . . . . . . . . . . . . . . . . . 6,656 5,946 6,043 5,384 5,869
Common shareholders’ equity . . . . . . . . . . . . . . . . . . 6,344 5,633 5,729 5,069 5,553
SE L E C T E D RA T I O S . . . . . . . . . . . . . . . . . . . . . . .
From Continuing Operations . . . . . . . . . . . . . . . .
Return on . . . . . . . . . . . . . . . . . . . . . . . . . . . . . . . .
Average common shareholders’ equity . . . . . . . . . . 20.52% 21.29% 20.14% 19.74% 17.15%
Average assets . . . . . . . . . . . . . . . . . . . . . . . . . . . 1.76 1.76 1.55 1.52 1.44
Net interest margin . . . . . . . . . . . . . . . . . . . . . . . . . . 3.64 3.86 3.99 3.98 3.85
Noninterest income to total revenue . . . . . . . . . . . . . . 56.99 50.87 45.35 39.61 33.73
Efficiency (b) . . . . . . . . . . . . . . . . . . . . . . . . . . . . . . 56.85 55.54 54.81 55.33 55.87
From Net Income
Return on . . . . . . . . . . . . . . . . . . . . . . . . . . . . . . . .
Average common shareholders’ equity . . . . . . . . . . 21.63 22.41 20.81 20.01 17.18
Average assets . . . . . . . . . . . . . . . . . . . . . . . . . . . 1.68 1.69 1.49 1.49 1.40
Net interest margin . . . . . . . . . . . . . . . . . . . . . . . . . . 3.37 3.68 3.85 3.94 3.83
Noninterest income to total revenue . . . . . . . . . . . . . . 59.28 52.79 46.97 41.29 35.68
Efficiency (c) . . . . . . . . . . . . . . . . . . . . . . . . . . . . . . 55.17 54.82 54.76 56.07 56.95
Dividend payout . . . . . . . . . . . . . . . . . . . . . . . . . . . . 42.06 40.22 43.43 45.39 48.89
Leverage (d) . . . . . . . . . . . . . . . . . . . . . . . . . . . . . . . 8.03 6.61 7.28 7.30 7.70
Common shareholders’ equity to assets . . . . . . . . . . . 9.08 8.13 8.10 7.07 7.79
Average common shareholders’ equity to average assets 8.44 8.13 7.56 7.57 8.32
(a) Excludes amortization of goodwill.
(b) Excludes amortization and distributions on capital securities.
(c) Excludes amortization, distributions on capital securities and residential mortgage banking risk management activities.
(d) Includes discontinued operations in the years 1996 through 1999.
33