PNC Bank 2000 Annual Report Download - page 93
Download and view the complete annual report
Please find page 93 of the 2000 PNC Bank annual report below. You can navigate through the pages in the report by either clicking on the pages listed below, or by using the keyword search tool below to find specific information within the annual report.-
 1
1 -
2
-
3
-
4
-
5
-
6
-
7
-
8
-
9
-
10
-
11
-
12
-
13
-
14
-
15
-
16
-
17
-
18
-
19
-
20
-
21
-
22
-
23
-
24
-
25
-
26
-
27
-
28
-
29
-
30
-
31
-
32
-
33
-
34
-
35
-
36
-
37
-
38
-
39
-
40
-
41
-
42
-
43
-
44
-
45
-
46
-
47
-
48
-
49
-
50
-
51
-
52
-
53
-
54
-
55
-
56
-
57
-
58
-
59
-
60
-
61
-
62
-
63
-
64
-
65
-
66
-
67
-
68
-
69
-
70
-
71
-
72
-
73
-
74
-
75
-
76
-
77
-
78
-
79
-
80
-
81
-
82
-
 83
83 -
 84
84 -
 85
85 -
 86
86 -
 87
87 -
 88
88 -
 89
89 -
 90
90 -
 91
91 -
 92
92 -
 93
93 -
 94
94 -
 95
95 -
 96
96
 |
 |

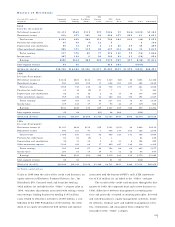
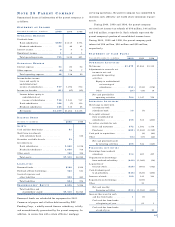
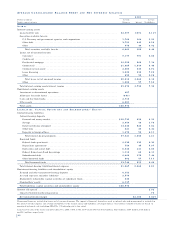
AL L O W A N C E F O R CR E D I T LO S S E S
SU M M A R Y O F LO A N LO S S EX P E R I E N C E
Year ended December 31 - dollars in millions 2000 1999 1998 1997 1996
Allowance at beginning of year . . . . . . . . . . . . . . . . . . . . . . . . . . . $674 $753 $972 $1,166 $1,259
Charge-offs
Consumer . . . . . . . . . . . . . . . . . . . . . . . . . . . . . . . . . . . . . . . . 46 63 83 104 100
Credit card . . . . . . . . . . . . . . . . . . . . . . . . . . . . . . . . . . . . . . . 60 297 208 66
Residential mortgage . . . . . . . . . . . . . . . . . . . . . . . . . . . . . . . . 88799
Commercial . . . . . . . . . . . . . . . . . . . . . . . . . . . . . . . . . . . . . . . 121 72 122 48 52
Commercial real estate
Commercial mortgage . . . . . . . . . . . . . . . . . . . . . . . . . . . . . 21 6 8 10
Real estate project . . . . . . . . . . . . . . . . . . . . . . . . . . . . . . . 13248
Lease financing . . . . . . . . . . . . . . . . . . . . . . . . . . . . . . . . . . . . 89742
Total charge-offs . . . . . . . . . . . . . . . . . . . . . . . . . . . . . . . . . 186 216 524 385 247
Recoveries
Consumer . . . . . . . . . . . . . . . . . . . . . . . . . . . . . . . . . . . . . . . . 22 25 34 36 34
Credit card . . . . . . . . . . . . . . . . . . . . . . . . . . . . . . . . . . . . . . . 2 17 25 7
Residential mortgage . . . . . . . . . . . . . . . . . . . . . . . . . . . . . . . . 21112
Commercial . . . . . . . . . . . . . . . . . . . . . . . . . . . . . . . . . . . . . . . 21 22 20 38 28
Commercial real estate
Commercial mortgage . . . . . . . . . . . . . . . . . . . . . . . . . . . . . 31 2 10 6
Real estate project . . . . . . . . . . . . . . . . . . . . . . . . . . . . . . . 13124
Lease financing . . . . . . . . . . . . . . . . . . . . . . . . . . . . . . . . . . . . 21 2 1
Other . . . . . . . . . . . . . . . . . . . . . . . . . . . . . . . . . . . . . . . . . . . . 1 1
Total recoveries . . . . . . . . . . . . . . . . . . . . . . . . . . . . . . . . . 51 55 77 113 83
Net charge-offs . . . . . . . . . . . . . . . . . . . . . . . . . . . . . . . 135 161 447 272 164
Provision for credit losses . . . . . . . . . . . . . . . . . . . . . . . . . . . . . . . 136 163 225 70
(Divestitures)/acquisitions . . . . . . . . . . . . . . . . . . . . . . . . . . . . . . . (81) 3 8 71
Allowance at end of year . . . . . . . . . . . . . . . . . . . . . . . . . . . . . $675 $674 $753 $972 $1,166
Allowance as a percent of period-end
Loans . . . . . . . . . . . . . . . . . . . . . . . . . . . . . . . . . . . . . . . . . . . 1.33% 1.36% 1.31% 1.79% 2.25%
Nonperforming loans . . . . . . . . . . . . . . . . . . . . . . . . . . . . . . . . 208.98 231.62 263.29 360.00 337.97
As a percent of average loans
Net charge-offs . . . . . . . . . . . . . . . . . . . . . . . . . . . . . . . . . . . . .27 .31 .80 .51 .34
Provision for credit losses . . . . . . . . . . . . . . . . . . . . . . . . . . . . .27 .31 .40 .13
Allowance for credit losses . . . . . . . . . . . . . . . . . . . . . . . . . . . . 1.35 1.28 1.35 1.84 2.39
Allowance as a multiple of net charge-offs . . . . . . . . . . . . . . . . . . . 5.00x 4.19x 1.68x 3.57x 7.11x
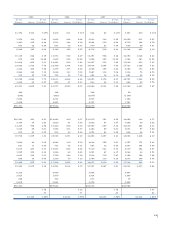
The following table presents the allocation of allowance for credit losses and the categories of loans as a percentage of total
loans. For purposes of this presentation, the unallocated portion of the allowance for credit losses has been assigned to loan
categories based on the relative specific and pool allocation amounts.
AL L O C AT I O N O F AL L O W A N C E F O R CR E D I T LO S S E S
2000 1999 1998 1997 1996
December 31 Loans to Loans to Loans to Loans to Loans to
Dollars in millions Allowance Total Loans Allowance Total Loans Allowance Total Loans Allowance Total Loans Allowance Total Loans
Consumer . . . . . . . . . . . . . . . . $51 18.0% $58 18.8% $74 19.0% $107 20.7% $139 23.3%
Credit card . . . . . . . . . . . . . . . 136 5.1 258 7.0 141 5.4
Residential mortgage . . . . . . . . 10 26.2 10 25.2 8 21.3 42 23.6 80 24.5
Commercial . . . . . . . . . . . . . . . 536 41.9 510 43.2 446 43.7 406 36.9 606 35.9
Commercial real estate . . . . . . 53 5.1 64 5.5 59 6.0 141 7.3 173 7.9
Other . . . . . . . . . . . . . . . . . . . 25 8.8 32 7.3 30 4.9 18 4.5 27 3.0
Total . . . . . . . . . . . . . . . . . . $675 100.0% $674 100.0% $753 100.0% $972 100.0% $1,166 100.0%
90