PNC Bank 2000 Annual Report Download - page 49
Download and view the complete annual report
Please find page 49 of the 2000 PNC Bank annual report below. You can navigate through the pages in the report by either clicking on the pages listed below, or by using the keyword search tool below to find specific information within the annual report.-
 1
1 -
2
-
3
-
4
-
5
-
6
-
7
-
8
-
9
-
10
-
11
-
12
-
13
-
14
-
15
-
16
-
17
-
18
-
19
-
20
-
21
-
22
-
23
-
24
-
25
-
26
-
27
-
28
-
29
-
30
-
31
-
32
-
33
-
34
-
35
-
36
-
37
-
38
-
 39
39 -
 40
40 -
 41
41 -
 42
42 -
 43
43 -
 44
44 -
 45
45 -
 46
46 -
 47
47 -
 48
48 -
 49
49 -
 50
50 -
 51
51 -
 52
52 -
 53
53 -
 54
54 -
 55
55 -
 56
56 -
 57
57 -
 58
58 -
 59
59 -
60
-
61
-
62
-
63
-
64
-
65
-
66
-
67
-
68
-
69
-
70
-
71
-
72
-
73
-
74
-
75
-
76
-
77
-
78
-
79
-
80
-
81
-
82
-
83
-
84
-
85
-
86
-
87
-
88
-
89
-
90
-
91
-
92
-
93
-
94
-
95
-
96
 |
 |

46
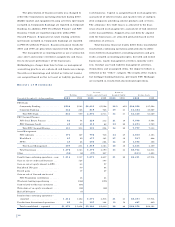
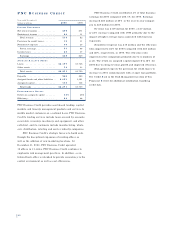
NO N I N T E R E S T EX P E N S E
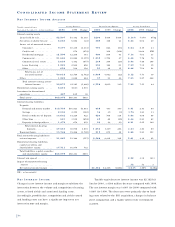
Noninterest expense was $3.071 billion for 2000 compared
with $2.703 billion for 1999, excluding non-core items that
are detailed in the 1999 Versus 1998 section of this
Financial Review. The efficiency ratio was 57% for 2000
compared with 55% for the prior year, also excluding non-
core items. The increases were primarily related to the ISG
acquisition. Excluding ISG, noninterest expense increased
2% compared with the prior year. Average full-time equiva-
lent employees totaled approximately 24,900 and 22,700
for 2000 and 1999, respectively. The increase was primarily
due to the ISG acquisition, partially offset by the impact
of efficiency initiatives in traditional banking businesses
and the sale of the credit card business in the first quarter
of 1999.
CO N S O L I D AT E D BA L A N C E SH E E T
RE V I E W
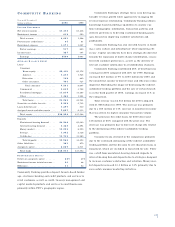
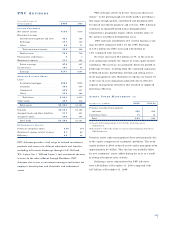
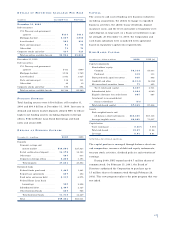
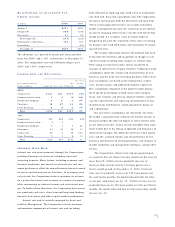
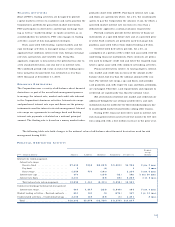
LO A N S
Loans were $50.6 billion at December 31, 2000, a
$928 million increase from year-end 1999 as increases in
residential mortgage loans and lease financing were partial-
ly offset by lower consumer, commercial and commercial
real estate loans.
DE TA I L S O F LO A N S
Year ended December 31
December 31 – in millions 2000 1999
Consumer
Home equity . . . . . . . . . . . . . . . . $6,228 $6,059
Automobile . . . . . . . . . . . . . . . . . 1,166 1,691
Other . . . . . . . . . . . . . . . . . . . . . 1,739 1,598
Total consumer . . . . . . . . . . . . 9,133 9,348
Residential mortgage . . . . . . . . . . . . 13,264 12,506
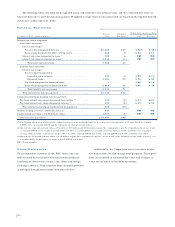
Commercial
Manufacturing . . . . . . . . . . . . . . . 5,581 5,355
Retail/wholesale . . . . . . . . . . . . . 4,413 4,301
Service providers . . . . . . . . . . . . . 2,900 3,208
Real estate related . . . . . . . . . . . 2,689 2,862
Communications . . . . . . . . . . . . . 1,286 1,370
Health care . . . . . . . . . . . . . . . . . 766 772
Financial services . . . . . . . . . . . . 823 1,300
Other . . . . . . . . . . . . . . . . . . . . . 2,749 2,300
Total commercial . . . . . . . . . . . 21,207 21,468
Commercial real estate
Mortgage . . . . . . . . . . . . . . . . . . . 673 761
Real estate project . . . . . . . . . . . 1,910 1,969
Total commercial real estate . . . 2,583 2,730
Lease financing . . . . . . . . . . . . . . . . 4,845 3,663
Other . . . . . . . . . . . . . . . . . . . . . . . 568 682
Unearned income . . . . . . . . . . . . . . (999) (724)
Total, net of unearned income . . . $50,601 $49,673
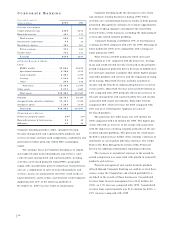
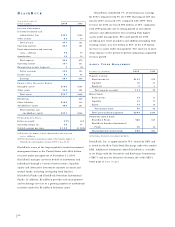
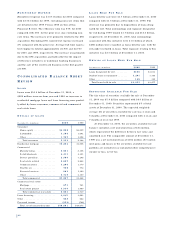
LO A N S HE L D FO R SA L E
Loans held for sale were $1.7 billion at December 31, 2000
compared with $3.5 billion at December 31, 1999. The
decrease was primarily due to dispositions of loans desig-
nated for exit. Total outstandings and exposure designated
for exit during 1999 totaled $3.7 billion and $10.5 billion,
respectively. At December 31, 2000, total outstandings
associated with this initiative were $1.0 billion of which
$286 million were classified as loans held for sale, with the
remainder included in loans. Total exposure relating to this
initiative was $2.7 billion at December 31, 2000.
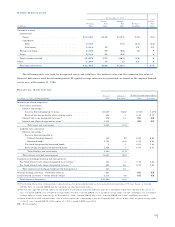
DE TA I L S O F LO A N S HE L D FO R SA L E
Year ended December 31
December 31 – in millions 2000 1999
Loans designated for exit . . . . . . . . . $286 $1,813
Student loans in repayment . . . . . . . 1,201 1,344
O t h e r . . . . . . . . . . . . . . . . . . . . . . . 168 320
Total loans held for sale . . . . . . . . $1,655 $3,477
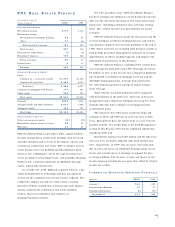
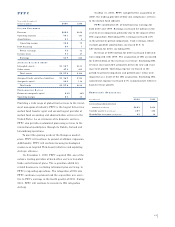
SE C U R I T I E S AV A I L A B L E FO R SA L E
The fair value of securities available for sale at December
31, 2000 was $5.9 billion compared with $6.0 billion at
December 31, 1999. Securities represented 8% of total
assets at December 31, 2000. The expected weighted-
average life of securities available for sale was 4 years and
5 months at December 31, 2000 compared with 4 years and
7 months at year-end 1999.
At December 31, 2000, the securities available for sale
balance included a net unrealized loss of $54 million,
which represented the difference between fair value and
amortized cost. The comparable amount at December 31,
1999 was a net unrealized loss of $184 million. Net unreal-
ized gains and losses in the securities available for sale
portfolio are included in accumulated other comprehensive
income or loss, net of tax.